
A customer journey map is a visual representation of the steps a customer takes to reach a goal with a company, including what they think and feel at each step across channels and over time.
Product, CX, marketing, and support teams use customer journey maps to build a shared picture of the entire customer experience, from initial awareness through post-purchase interactions. That shared view helps teams see where customers struggle, where handoffs break down, and where there are opportunities to improve customer satisfaction and potentially customer loyalty.
Let's take a look at what goes into a journey map, why user journey mapping matters, how to create a customer journey map in five steps, how it compares with related maps, how to turn insights into design work, and where AI can help.
What is a customer journey map?
A customer journey map shows what one customer or customer persona goes through in a specific situation, from start to finish. It lays out the main journey stages, what the customer does at each point, what they're thinking and feeling, and the touchpoints they encounter along the way.
UX mapping also helps highlight pain points and identify opportunities for improvement. The goal is to put all of this in one place so product teams can see the experience as a whole from a customer's perspective instead of looking at isolated interactions through the lens of a single department.
Nielsen Norman Group (NN/g) defines a journey map as "a visualization of the process that a person goes through in order to accomplish a goal."
That definition is intentionally broad as a customer journey map can follow someone across a website, product, email, sales call, support conversation, social media interaction, or online review. The journey might take a few days or stretch across several months.
A user flow on the other hand is much narrower. It usually stays inside one product and maps the steps needed to complete a specific task.
There’s also a useful way to think about the customer journey in terms of timing.
In a 2016 Journal of Marketing paper "Understanding Customer Experience Throughout the Customer Journey," Katherine N. Lemon and Peter C. Verhoef describe customer experience across three stages:
- Prepurchase
- Purchase
- Postpurchase
Once you've defined the journey or stage you're mapping, there's another distinction to make: are you documenting the experience as it exists today, or defining the experience you want to create?
That's where current-state and future-state journey maps come in:
- Current-state map: Shows how customers feel about the buying process today, including the interactions, friction, and existing pain points.
- Future-state map: Shows what the experience should look like after the team makes changes.
According to NN/g's 2023 survey of 343 practitioners, current-state maps are much more common as 89% said they used journey maps to evaluate current experiences. 73% used them to plan improvements to existing products or services, while 61% used them to explore future experiences for products or services that don't exist yet.
And despite how often journey mapping gets grouped with marketing or CX work, product teams are heavily involved. In NN/g's 2023 survey, journey-mapping projects included:
- Product roles: 70%
- Marketing: 46%
- Customer service or support: 42%
In short, journey mapping is a product activity, not just a marketing or customer experience exercise.
NN/g also found that most practitioners create journey maps collaboratively, bringing together people from different departments who each see a different part of the customer experience.
That cross-functional view is part of what makes journey mapping useful.
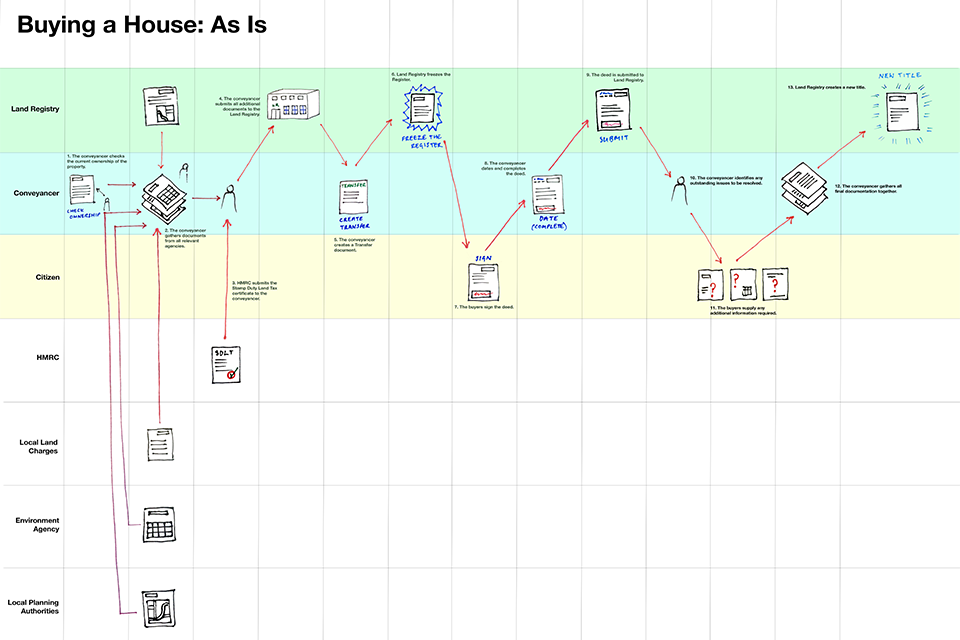
The UK Government Digital Service, for example, published a Land Registry journey map showing what happens when someone buys a house across multiple services and organizations. The map makes it much easier to see how one service fits into the larger journey and where changes outside that service might be needed.
What does a customer journey map include?
A customer journey map has four key components:
- The actor and scenario
- The phases
- What the customer does, thinks and feels in each phase
- Opportunities
Together, they show who the buyer journey map is about, what they're trying to accomplish, how the journey unfolds, what they experience along the way, and where the team can improve to boost brand loyalty and reduce customer churn. The map can also include touchpoints and channels to show where those interactions happen.
NN/g's Journey Mapping 101 breaks this journey map into the same five core components: actor, scenario and expectations, journey phases, actions/mindsets/emotions, and opportunities:
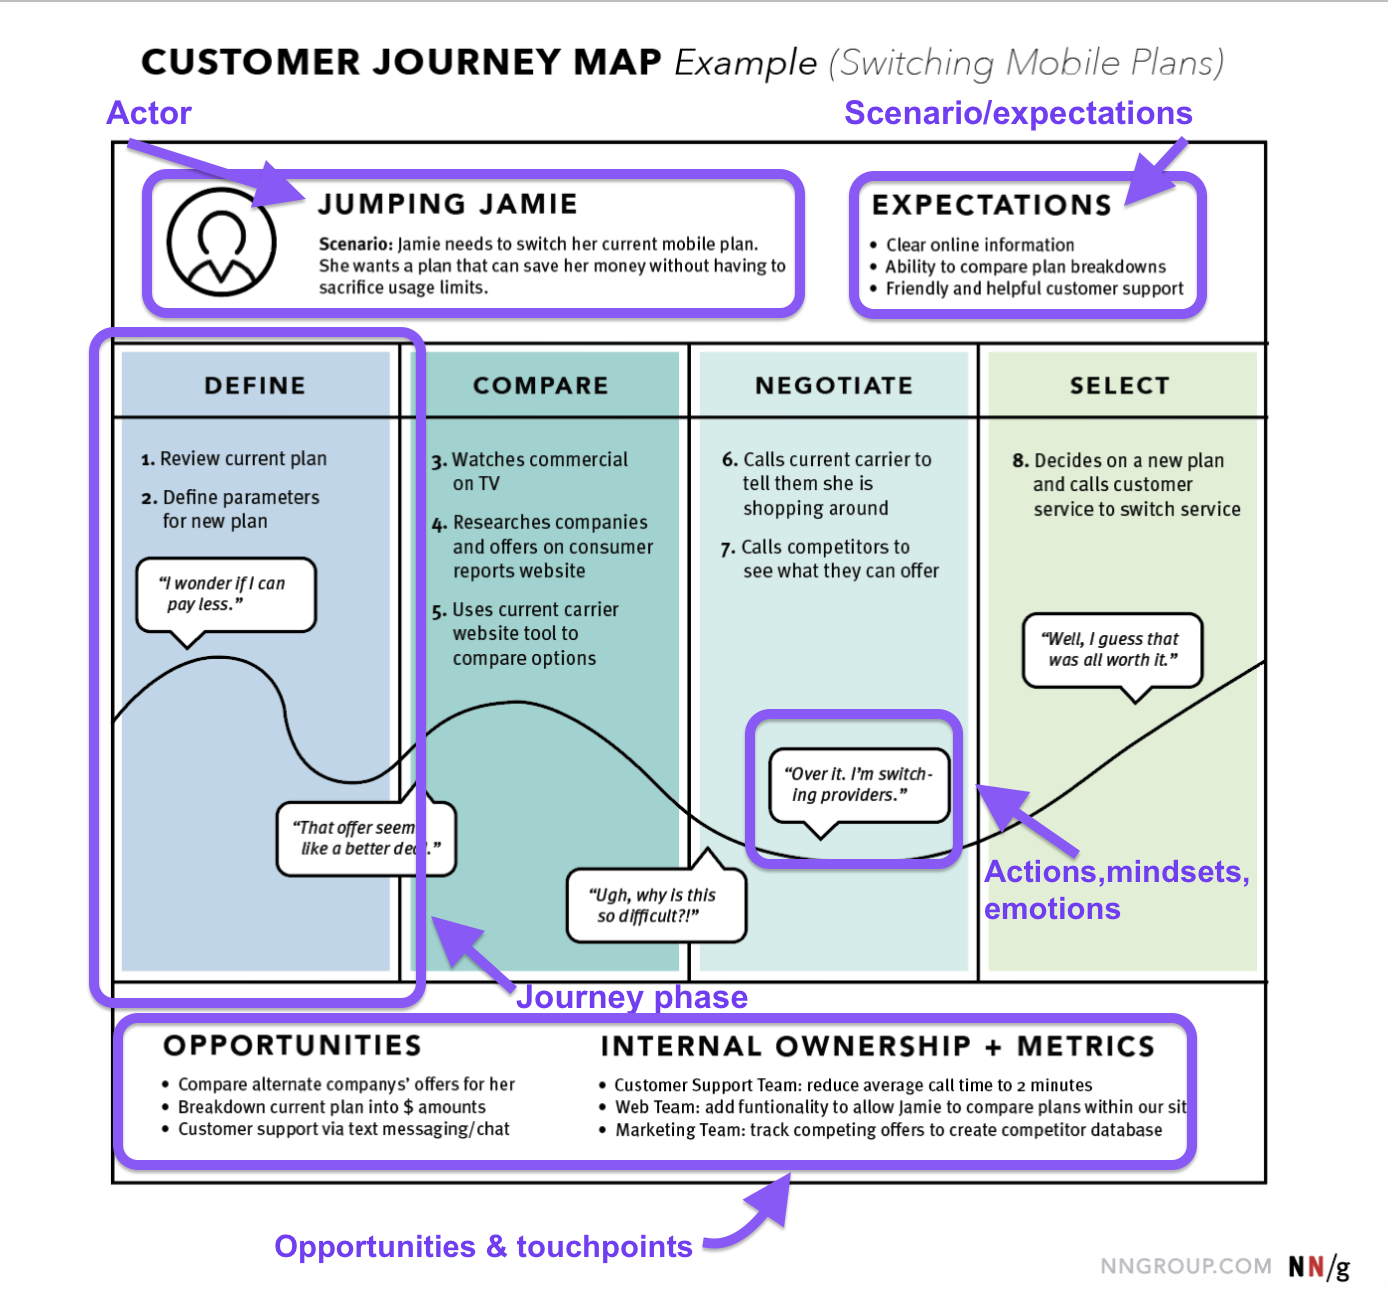
Actor
The actor is the specific persona whose experience you're mapping. Use one persona per map so the journey reflects one set of goals and behaviors. If a new customer and an experienced customer take different paths to accomplish different goals, they need separate maps rather than being combined into one.
For example, a project-management platform could create one map for a design lead evaluating tools for their team and another for an existing customer trying to roll out the product across multiple departments.
Scenario and expectations
The scenario defines what the persona is trying to accomplish and the situation they're in. Expectations capture what they believe should happen during that experience.
For example, the scenario could be "a design lead is evaluating project-management software for a 20-person team." Their expectations might include being able to compare plans easily, understand which features their team needs, and start a trial without talking to sales.
Journey phases
Journey phases are the major stages a customer moves through while trying to reach their goal. They should reflect the actual journey rather than simply copying your sales funnel.
Awareness, consideration, purchase, retention, and advocacy are commonly used as the five stages of the customer journey in marketing. Lemon and Verhoef's research framework, meanwhile, divides the customer experience into prepurchase, purchase, and postpurchase.
For your own map, choose phases that match the scenario you're studying.
For example, a B2B software evaluation might have phases such as research, comparison, trial, internal approval, and purchase, while a support journey could involve identifying a problem, looking for help, troubleshooting, and resolution.
A current-state map shows how that journey works today. Whereas a future-state map shows how the team wants it to work after making changes.
Actions, mindsets, and emotions
Customer journey maps often include emotional responses at each stage to show what the customer does, thinks, and feels within each phase.
Customer actions might include comparing vendors, asking a colleague for recommendations, starting a free trial, or contacting support. Mindsets capture what the customer is trying to understand, such as "Which plan do I actually need?"
The emotion line shows how the customer's experience changes across the journey. It might dip when a customer struggles to compare pricing and rise again when they find a clear answer. Those emotions should come from what customers said or did, not from what the team assumes they feel.
Interviews, customer surveys, support conversations, reviews, and observed behavior can all provide a deeper understanding for different stages of the mapping process.
Opportunities
Opportunities are the part of the map that turns customer pain points into potential actions.
If customers repeatedly struggle to compare plans, for example, the opportunity might be to redesign the pricing page or add a clearer comparison tool. The map can then connect that opportunity to the team responsible for addressing it.
Touchpoints and channels
Touchpoints are the individual interactions a customer has during the journey, while channels are where those interactions happen. They might include a website, product interface, onboarding email, sales call, support chat, review site, or community thread.
Lemon and Verhoef identify four types of touchpoints:
- Brand-owned: An onboarding email or product interaction controlled by the company.
- Partner-owned: A software listing in an integration marketplace managed by a partner.
- Customer-owned: A spreadsheet a customer creates to compare competing vendors.
- Social/external/independent: A peer review on G2 or a discussion in a community thread.
Product teams tend to map the brand-owned interactions because they're the easiest to see and control.
Customer-owned and external touchpoints are easier to miss, but they can have a major influence on the buying journey. A customer might compare vendors in their own spreadsheet or read several peer reviews before they ever visit your product or service, so leaving those interactions out can give the team an incomplete picture of what actually drives the decision.
| Component | Question it answers | Where the data comes from |
|---|---|---|
| Actor | Who is this about? | Customer personas, interviews, customer research |
| Scenario and expectations | What are they trying to do, and what do they expect? | Interviews, surveys, support data |
| Journey phases | What are the major stages? | Customer research, behavior, analytics |
| Actions | What does the customer do? | Interviews, observation, analytics |
| Mindsets and emotions | What are they thinking and feeling? | Interviews, surveys, customer feedback |
| Opportunities | What could the team improve? | Pain points, research findings, team analysis |
| Touchpoints and channels | Where do interactions happen? | Research, analytics, support data, reviews |
Why map journey stages instead of individual touchpoints?
Customers judge the entire customer journey, not just individual interactions.
That means your website visit can run smoothly, a sales call can be helpful, and customer support can respond quickly, yet the experience can still fall apart when the customer moves between teams.
Journey mapping is exactly what makes those handoffs visible. It shows how customer touchpoints connect across the experience and helps teams find pain points that may be invisible when each department looks only at its own interactions.
In a 2013 Harvard Business Review article, Rawson, Duncan, and Jones analyzed customer data from seven pay-TV companies and seven auto-insurance companies. They found that performance across customer journeys was:
- 30–40% more strongly correlated with customer satisfaction than individual touchpoint performance.
- 20–30% more strongly correlated with business outcomes than touchpoint performance.
In both industries, a one-point improvement in satisfaction with key journeys, on a 10-point scale, corresponded with at least a two-percentage-point higher revenue growth rate. These are correlations though, not proof that improving a journey causes revenue growth, and the findings come from a 2013 HBR article rather than a peer-reviewed study.
The same HBR article describes an unnamed energy company that mapped its moving-house journey and found 19 customer interactions involving complex handoffs between internal groups.
After redesigning the journey across teams:
- The process became four times more efficient
- Customer dissatisfaction fell significantly
- The company reported a €4 million revenue gain
The example shows why looking only at individual touchpoints can miss the real problem: each team may be doing its job well while the customer still experiences a fragmented journey.
Journey mapping also needs to reflect actual customer behavior, rather than assumptions about what matters. In a 2017 Business Horizons study, Rosenbaum, Otalora, and Ramírez surveyed 100 shoppers at one mall and found that different touchpoints were experienced by very different proportions of customers:
- 95% recommended a store to others.
- 46% received comments from other people shopping with them.
The study is based on one mall and 100 respondents, so these figures aren't universal benchmarks.
But the takeaway is how using customer research and customer data can help understand which interactions actually matter to your customer segments. Don't build the map around touchpoints that management simply assumes are important.
How to create a customer journey map in 5 steps
To create a useful customer journey map, start by defining the business decision the map needs to inform. Then choose one persona and scenario, break the experience into relevant journey phases, document what customers do, think, and feel, and turn the resulting pain points into opportunities.
Keep the scope narrow enough to capture a meaningful experience rather than an entire relationship with your brand. The five steps are:
- Set the business goal, persona, and scenario.
- Research the customer journey.
- Map the current-state experience.
- Identify pain points and opportunities.
- Turn the findings into actions and improvements.
1. Set the business goal, customer persona, and scenario
Start with the business goal before you start drawing anything. Write one sentence describing the decision the map should help the team make.
For example: "We want to understand why new customers abandon onboarding before completing their first project."
This gives the mapping exercise a clear purpose and keeps the team focused on findings it can actually use.
Next, choose one customer persona and scenario. A buyer persona represents the specific customer you're mapping, while the scenario describes what they're trying to accomplish. A design lead evaluating project-management software, with the scenario of comparing tools before recommending one to their team is a great buyer persona example.
Remember to keep the scenario narrow enough that the journey has a clear beginning and end. If you're trying to map everything a customer does with your product or service, you'll likely end up with too many paths, exceptions, and customer segments to make the map useful.
The Government Digital Service (GDS) ran into exactly this problem when it mapped the pensions journey. The map covered the experience from receiving a National Insurance number through retirement and included many government services.
The team found that "there are very few fixed points in this journey that all users will share - it spans too much time, and too many possibilities."
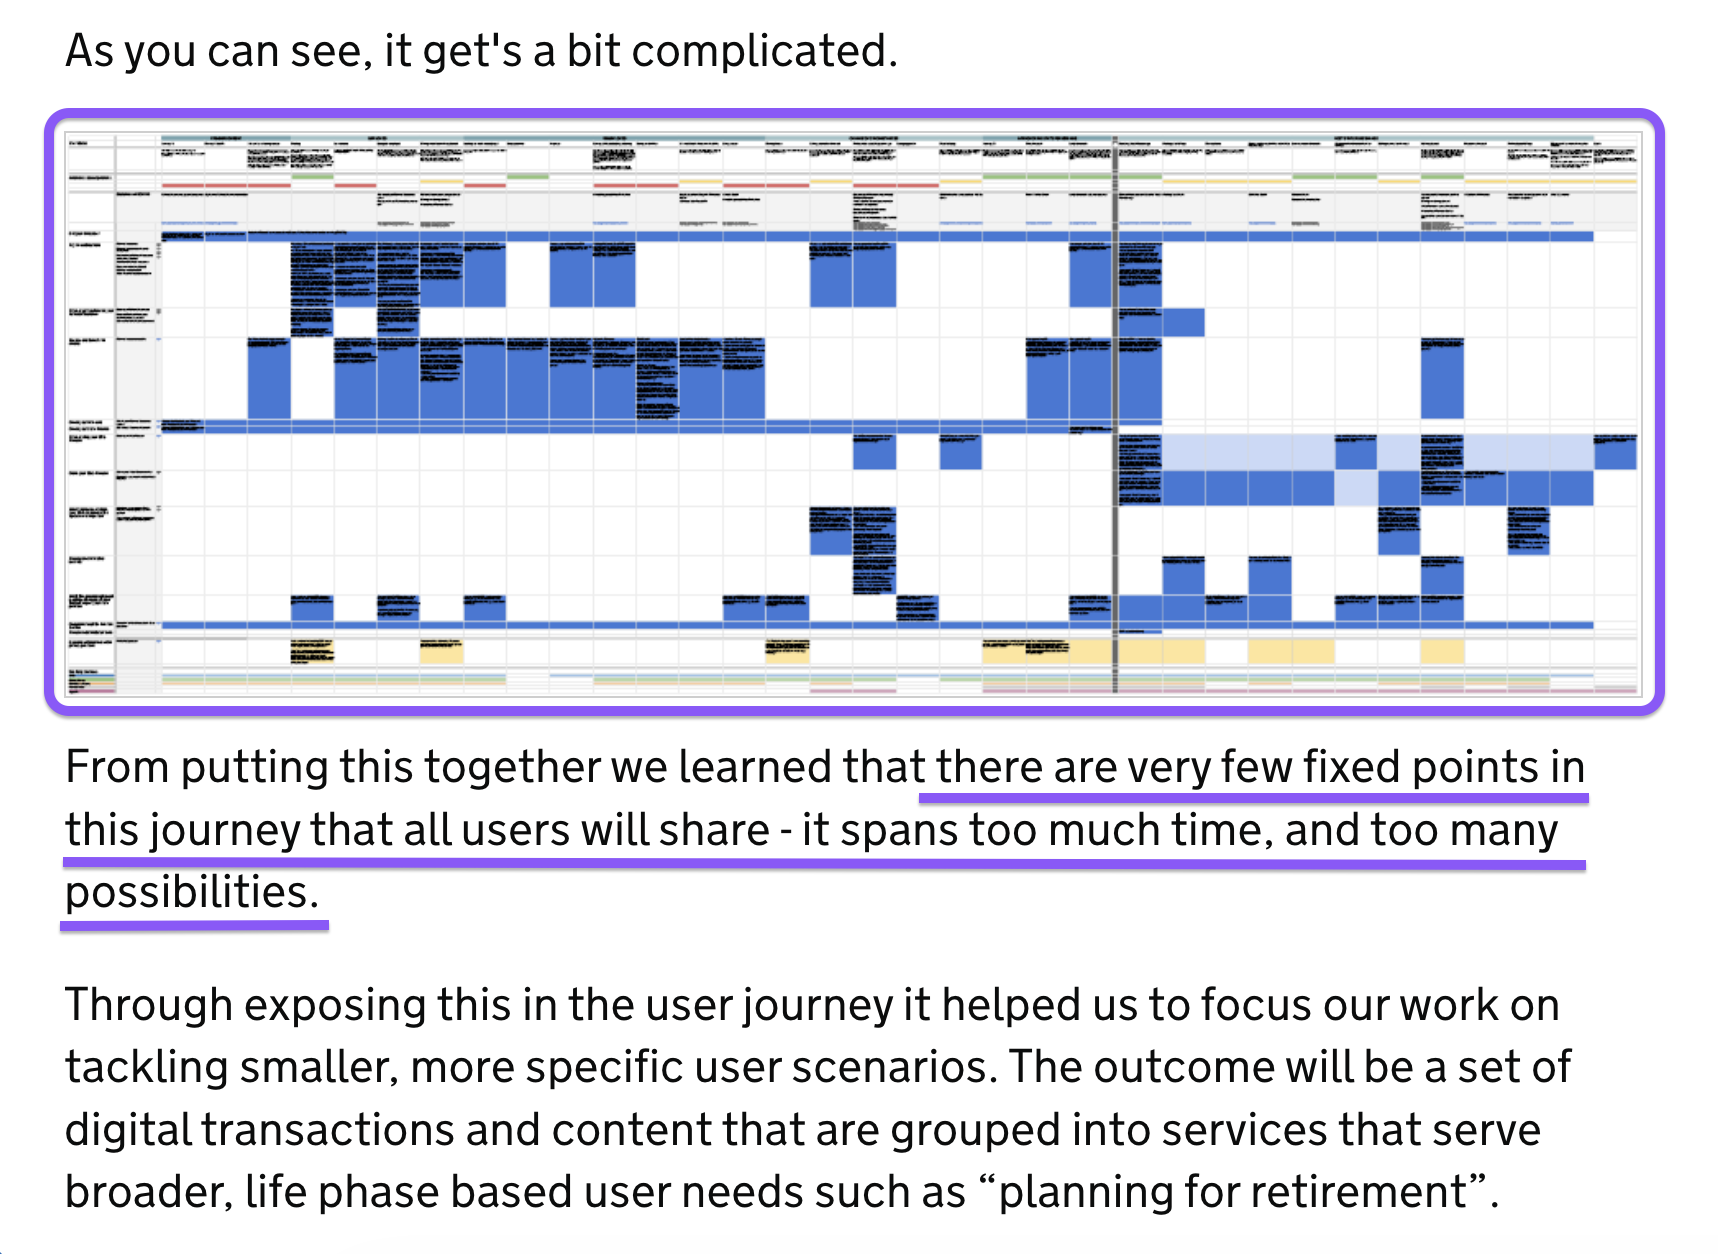
Instead of trying to make that broad journey work, the team used what they learned to focus on smaller, more specific user scenarios, such as planning for retirement.
That's a useful test for your own map: if you can't describe the customer's goal and scenario in one clear sentence, the scope is probably too broad.
2. Gather research before you draw anything
Before you create a customer journey map, gather the customer data you already have.
Product teams often have more useful research than they realize: customer interviews, support tickets, sales call notes, product analytics, reviews, and surveys can all provide valuable insights on how customers interact, where they struggle, and customer expectations.
Combining these sources gives you a stronger starting point than relying on assumptions about customer behavior.
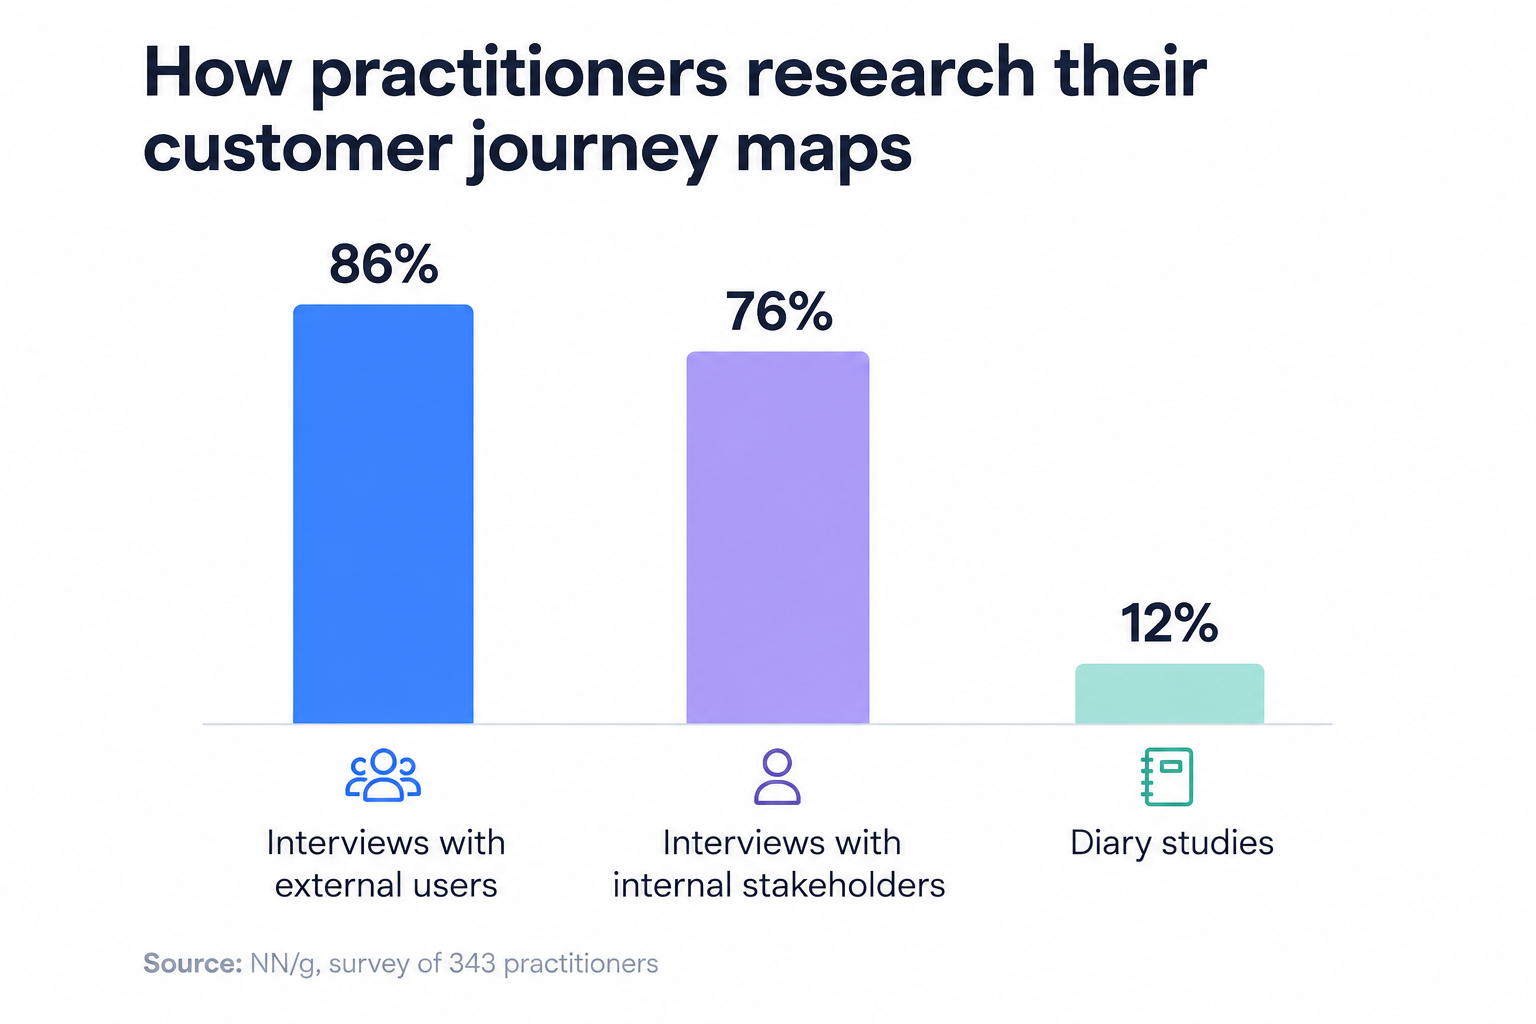
In one NN/g survey of 343 practitioners, the most commonly used research method found was:
- 86% used interviews with external users
- 76% used interviews with internal stakeholders
- 12% used diary studies
The same survey found that 62% began their mapping process with a hypothesis map based on existing knowledge, while 35% started with a dedicated research phase.
A hypothesis map can be a useful starting point when you need to move quickly or already have relevant research. Just label assumptions as assumptions, then validate them with customer evidence before using them to make decisions.
NN/g specifically recommends following a hypothesis-first approach with user research to validate or evolve those assumptions.
You can also use a simple approach from Rosenbaum et al.'s research to understand which customer touchpoints actually belong on your map: list the interactions you think customers encounter, then ask customers which ones they actually experienced. This helps you distinguish the touchpoints that exist in your internal view from the ones customers actually encounter during the journey.
For example, a software team might assume that its website, demo, and onboarding flow are the main interactions in the buying process.
The research stage could reveal that buyers also rely heavily on peer recommendations, review sites, or conversations with colleagues. Those findings give you more useful customer journey insights and help you identify pain points based on what customers actually experience.
3. Lay out the timeline, then add thoughts and emotions
Once you have your research, turn it into a timeline of what the customer actually does.
As per NN/g,
"Journey mapping starts by compiling a series of user actions into a timeline. Next, the timeline is fleshed out with user thoughts and emotions in order to create a narrative. This narrative is condensed and polished, ultimately leading to a visualization.”
Start with the actions, but don't turn the map into a log of every click. NN/g recommends using the actions to tell the story of what the customer does during each journey phase.
Instead, write those actions from the customer's perspective and in language that describes what they actually did.
“Asks a colleague which project management tool they use” is more useful than an internal label such as “lead qualification.”
I tried this with my own experience signing up for Asana after comparing it with other project management tools. My initial timeline was simple:
- Compare different project management tools
- Sign up for Asana
- Answer onboarding questions
- Invite a colleague
- Enter the workspace
- Explore the platform
I grouped those actions into four phases: Evaluate → Sign up → Set up → Explore.
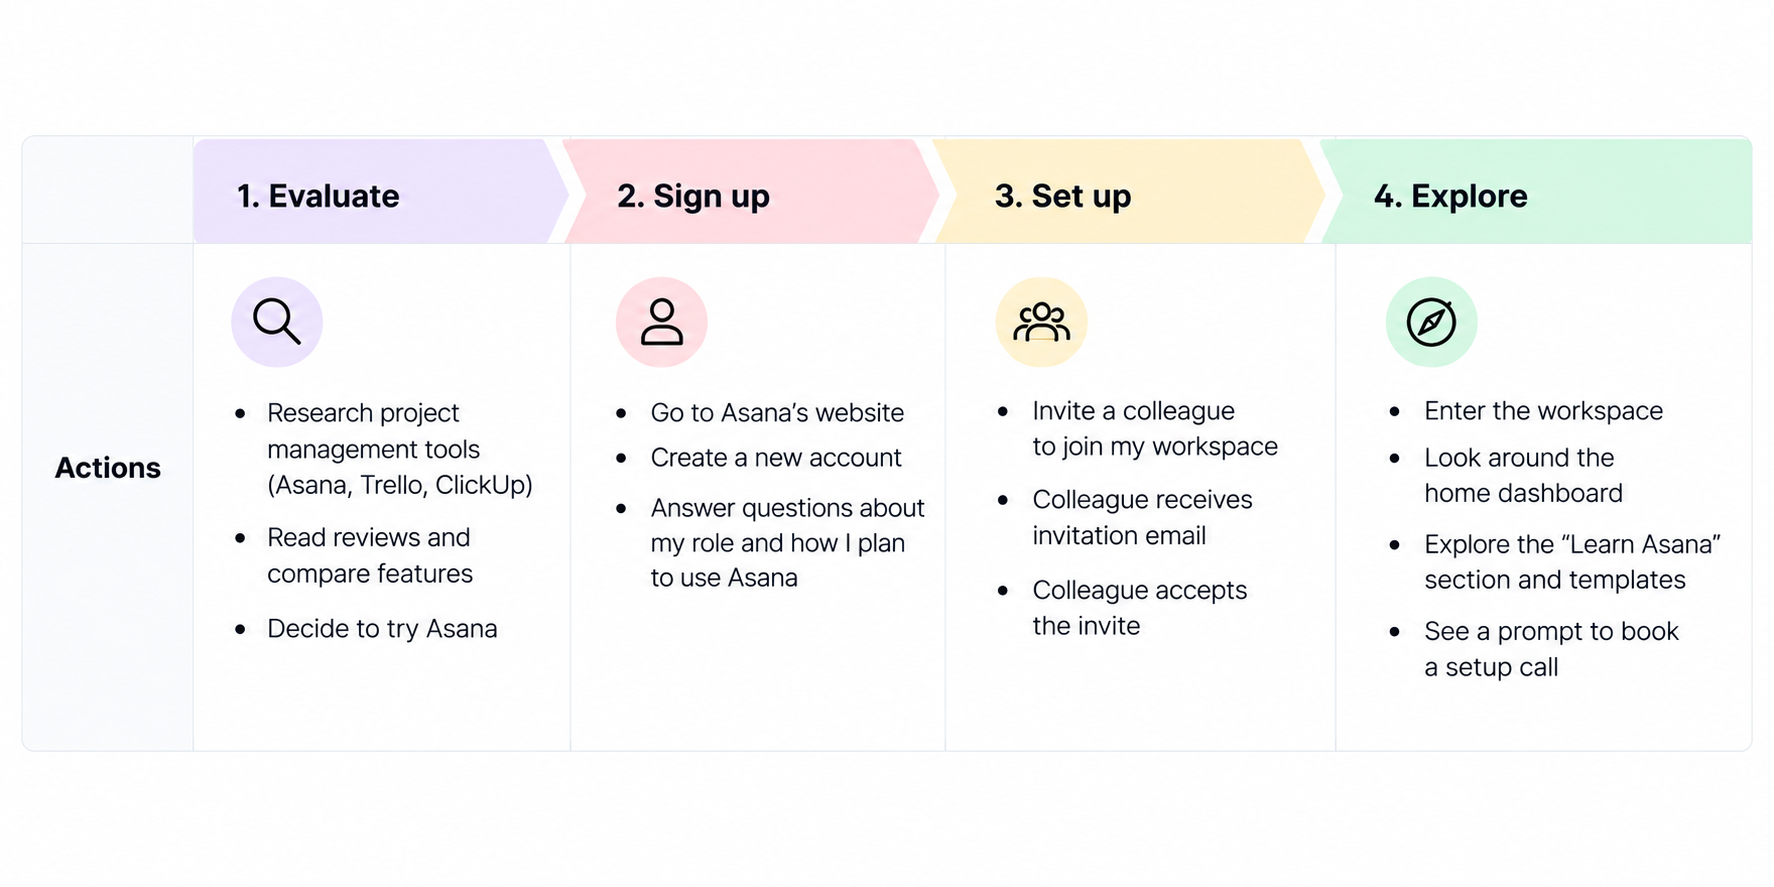
Then I added what I was thinking and feeling at each stage.
NN/g recommends using customer verbatims for mindsets where possible, so the goal isn't to guess what someone felt. In my case, I was interested in seeing how Asana would adapt to my work when it asked about my role and intended use.
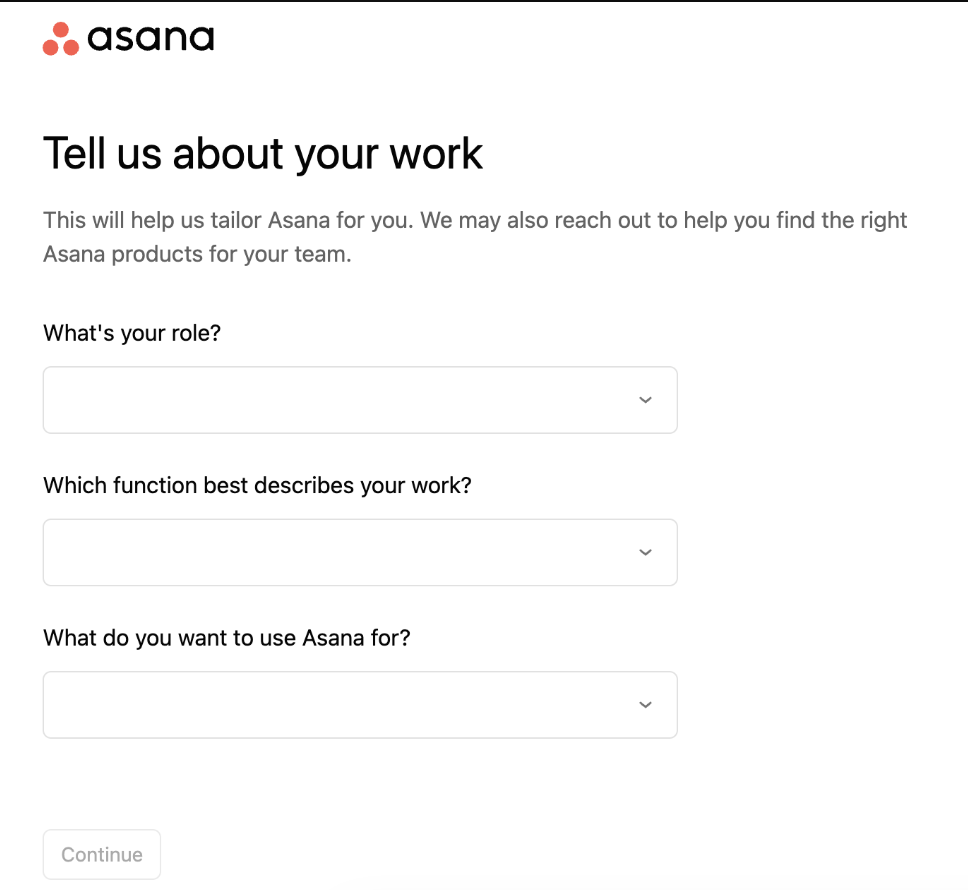
Once I entered the workspace though, I felt slightly lost about where to start. But the Learn Asana tab and ready-made templates gave me clearer ways to continue exploring.
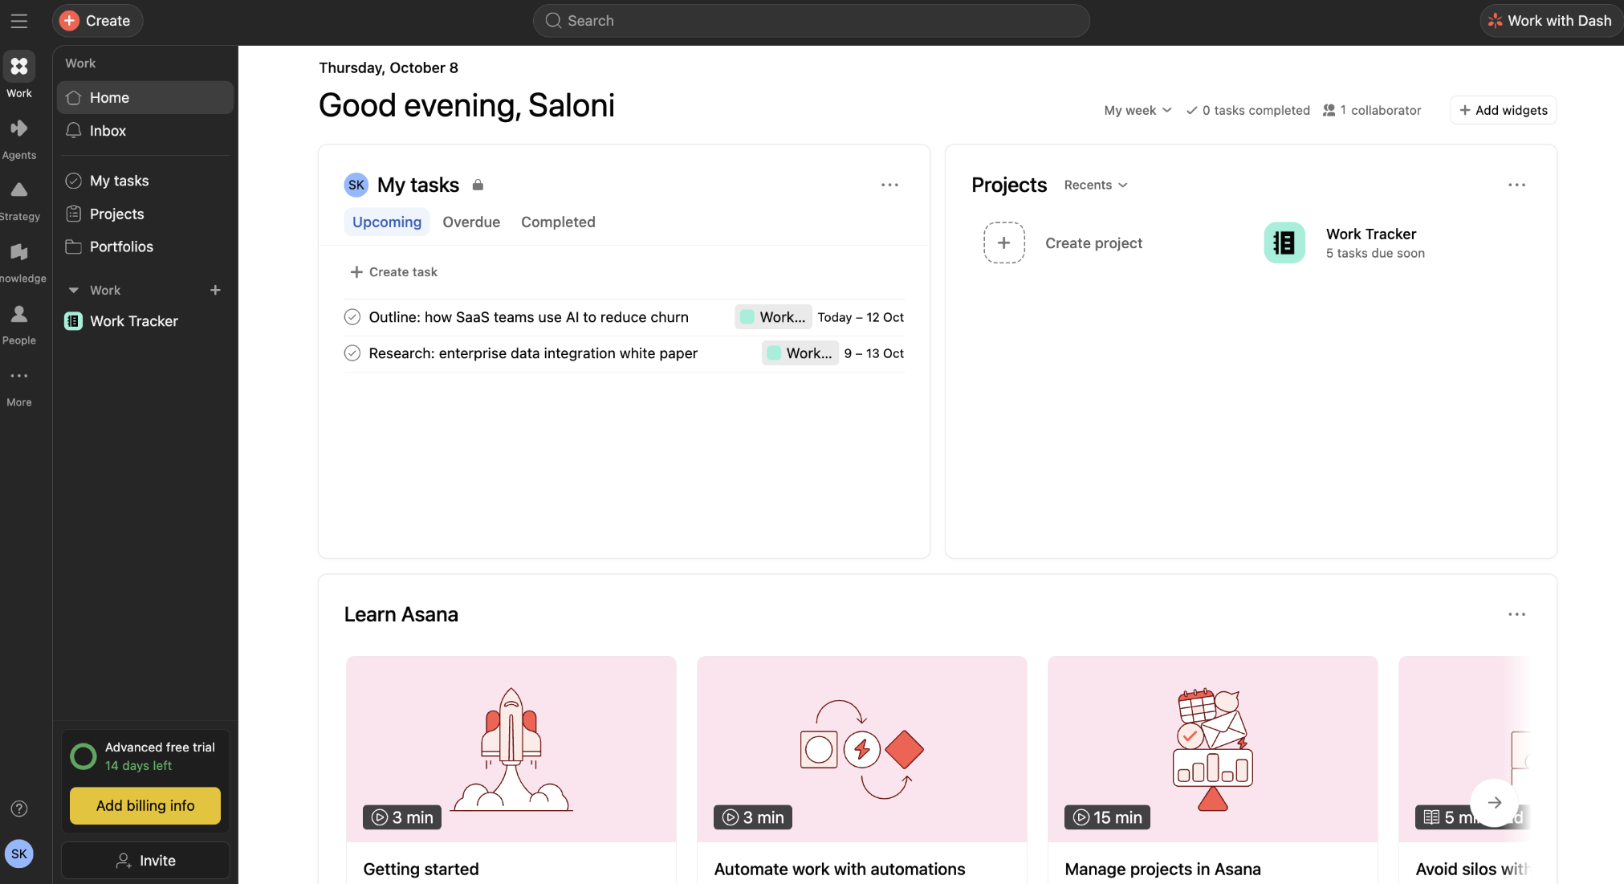
The emotion line helped make that shift visible. NN/g describes it as a single line running across the journey, addressing pain points and the emotional ups and downs of the experience.
For the Asana journey, I could connect those changes to the evidence I collected: the onboarding screens, invitation emails, the workspace itself, and the later in-product prompt offering a 45-minute setup call.
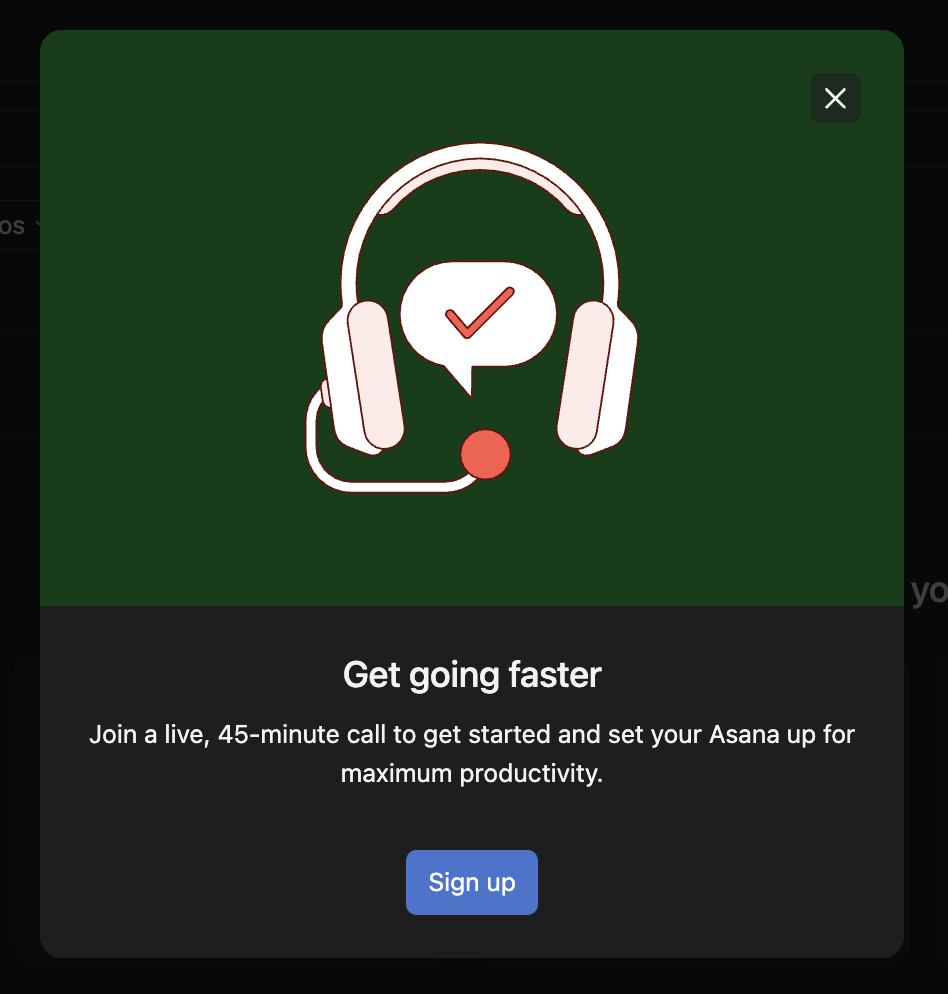
And you don't need a specialized customer journey mapping tool to create this. Sticky notes, a whiteboard, spreadsheet, or design file can all work. I created this on a blank design canvas. You can also start from customer journey map templates if you prefer.
The important part is being able to see the sequence of actions and how the customer's experience changes across the journey.
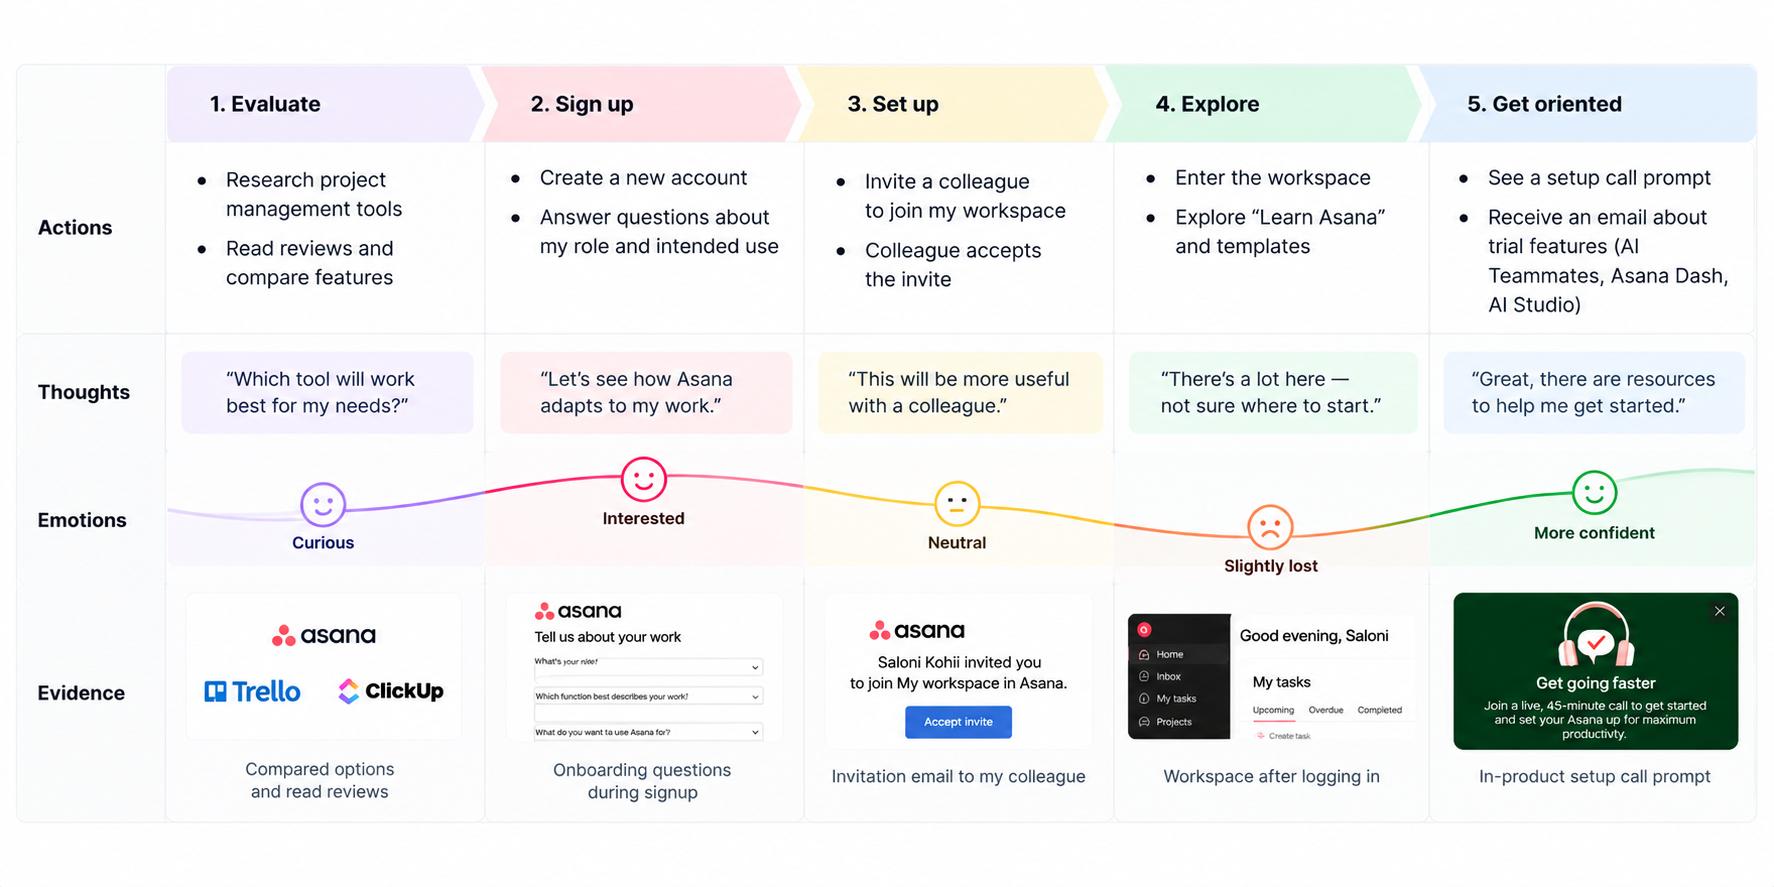
Looking back at my Asana journey, what surprised me was how much of the experience continued after signup. I expected the journey to be mostly about creating an account and exploring the workspace, but emails, teammate invitations, learning resources, templates, and in-product prompts all became part of the onboarding experience.
4. Add opportunities and name an owner for each stage
By this point, your journey map should show where customers struggle. The next step is to turn those pain points into specific opportunities for improvement. An opportunity should describe a change the team could actually make, rather than simply restating the problem.
For example, if customers reach the purchase stage and feel unsure about which plan they need, the pain point might be “Customers cannot tell which plan fits their needs.” And the opportunity could be “Make plan differences easier to compare.” That gives the team something concrete to work on.
I used the same approach with my Asana journey map example. I found three opportunities that could make the journey smoother:
- Explore: Make the first screen that users are introduced to clearly point toward a starting action.
Owner: Product
Metric: Time to first project - Set up: Make teammate invitations explain what happens after someone accepts.
Owner: Customer success
Metric: Invitation-to-activation rate - Get oriented: Make setup guidance easier to discover when a new user appears unsure where to begin.
Owner: Customer success
Metric: Setup-call booking or onboarding completion rate
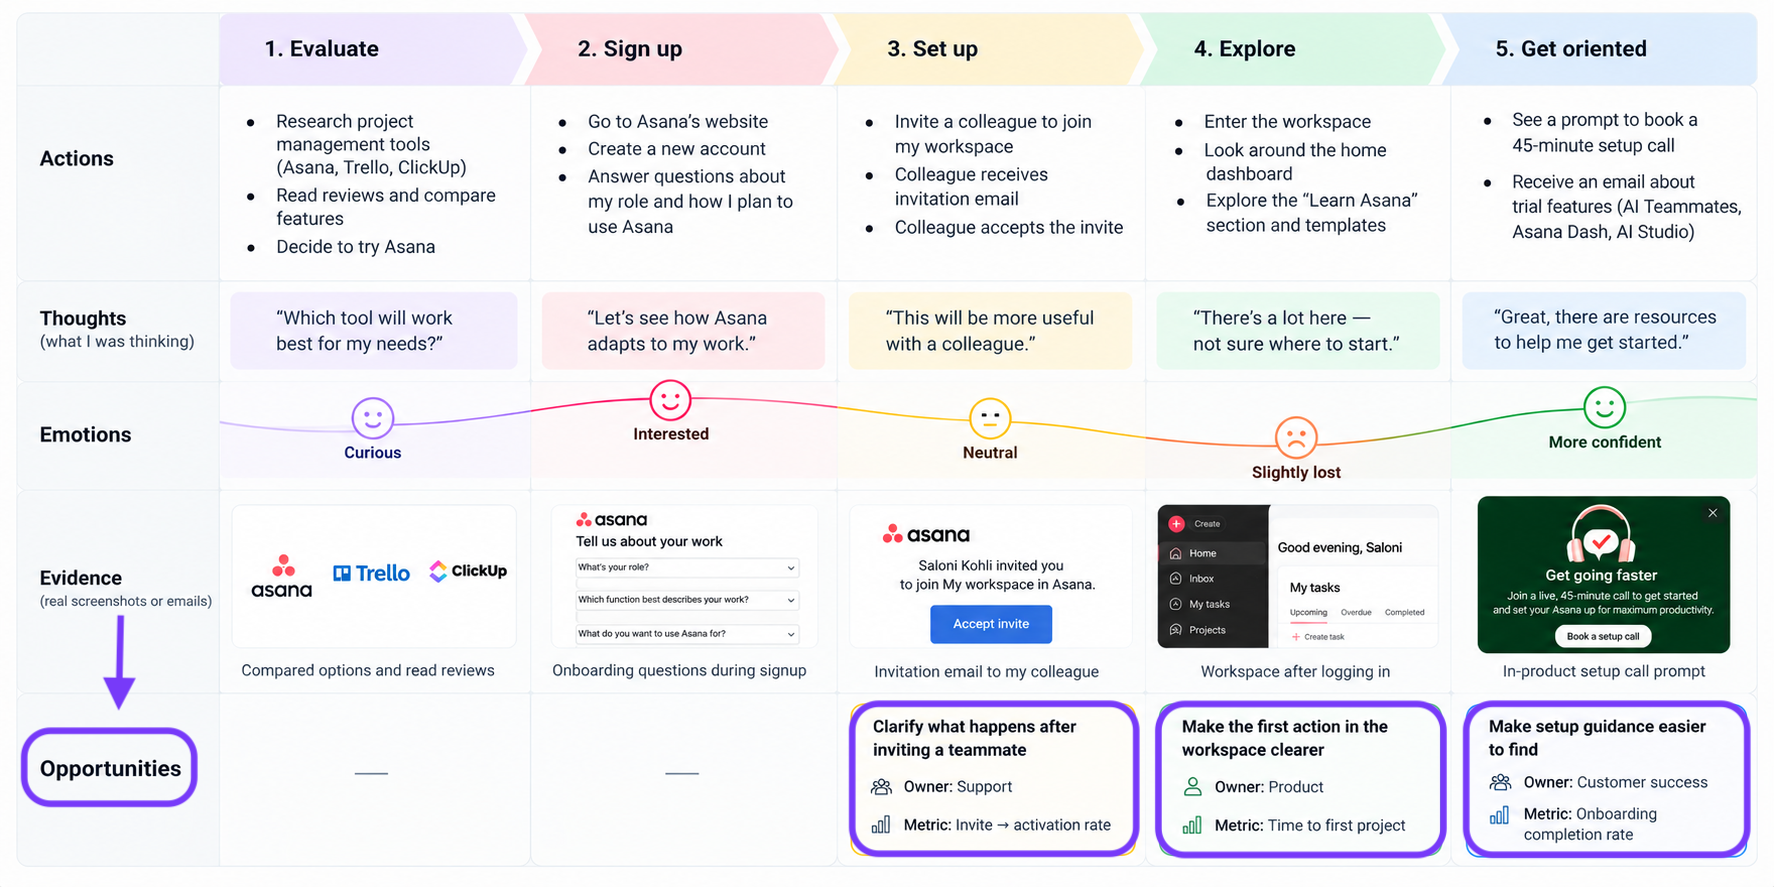
It's important to mention the owner for each opportunity because customer journey improvements rarely sit entirely within just the product team.
A specific pain point might come from billing, support, sales, customer success, or another part of the business. The idea is to build cross-functional accountability around journeys with clear ownership, authority, metrics, and performance expectations.
This way, instead of leaving key insights on a board, you connect each opportunity to the team that can act on it and a metric that can show whether the change worked. And the owner doesn't have to be the person who created the journey map. They need to be the person with enough authority and context to move the opportunity forward.
This is also where journey mapping differs from simply documenting customer actions.
The customer journey map puts you in the customer's shoes and shows what customers feel and where their needs are not being met. The opportunities lane on the other hand connects those specific pain points to internal processes and business decisions.
For a product team, that might mean taking an opportunity from the journey map into a product backlog, service blueprint, user flow, or design exploration.
A journey map example can show you where the experience breaks down, but the owner and metric are what turn those key insights into action. Otherwise, the map is useful research that never changes the ideal customer journey.
5. Build the map with the people who own the touchpoints
When creating your customer journey map, remember to bring in the people responsible for the touchpoints customers actually move through: product, support, sales, marketing, and billing.
They each see a different part of the customer journey. Sales knows what customers expect before they buy. Product sees how they use the product. Support sees recurring problems. Marketing sees how people discover and evaluate the brand, and billing or finance sees what happens around payment and renewal.
Getting these teams together helps you:
- Catch assumptions about how customers interact with the business
- Connect customer feedback to the right team
- Identify pain points that sit between departments
- See where internal processes are creating friction
- Build a shared view of the customer's point of view
NN/g's research shows us that out of 343 practitioners, 64% said they created customer journey maps collaboratively. 34% used physical tools, while 30% used digital tools.
Both approaches work. Use sticky notes and a wall if everyone is in the same room, or a shared digital canvas if the team is distributed. The important part is that everyone can add to and change the map during the session.
And you also don't need to map the entire buying journey at once. Keep the group focused on one target customer persona, one journey, and the specific customer needs you're trying to understand. That makes it easier to connect the research to key pain points instead of filling the map with everything the company knows about its customers.
An unnamed energy company cited in a 2013 HBR article used a similar approach by bringing cross-functional teams together in a “war room” and then testing changes with pilot teams as they redesigned its moving-house journey.
A structured workshop can make this easier to run. A user journey workshop walks teams through the activities involved in creating a user journey map, so everyone is working from the same process rather than building separate versions of the journey.

How is a customer journey map different from a user journey map, a service blueprint and a user flow?
A customer journey map looks at the entire experience with a company, while the other maps focus on a specific product, task, internal process, or broader human experience. Here's how they differ:
- Customer journey maps cover the full experience with a company, from discovering the brand to using its products and getting support.
- User journey maps focuses on a user's experience with one product or feature to identify friction and improve the experience.
- User flows break down the screens, decisions, and steps someone follows to complete a task, such as signing up or checking out.
- Service blueprints show the customer journey alongside the people, systems, and internal processes that support each interaction.
- Experience maps explores how people meet a need or reach a goal, without tying the experience to a specific company or product.
Here's how to choose the right framework for your project:
| Map type | What it covers | Typical timeframe | Perspective | Best used for |
|---|---|---|---|---|
| Customer journey map | Interactions with a company across channels | Weeks to months | Customer | Understanding the end-to-end customer experience and identifying pain points across teams |
| User journey map | Experience with one product or feature | Usually days | User | Improving a product experience and informing design decisions |
| Service blueprint | The customer journey and the operations behind each touchpoint | Varies | Organization and its internal processes | Finding operational problems that affect the customer experience |
| User flow | Screens, decisions, and system responses within a product | Often minutes | Product and task | Designing a clear path through a task, such as signing up or checking out |
| Experience map | A human experience that's not tied to a specific company | Varies | Person experiencing it | Exploring user needs and behavior during early research |
As NN/g explains in their article on Journey Mapping 101, a service blueprint reveals the internal processes behind a customer experience, while an experience map explores a broader human experience beyond a specific brand.
So which should you use?
In short, you should use a customer journey map to understand the full experience across a company, a user journey map to improve a specific product experience or customer expectations, and a user flow to map the steps within a task.
A service blueprint helps uncover internal processes affecting that experience, while an experience map explores broader human needs beyond a particular product or brand.
How do product teams turn a customer journey map into design work?
A customer journey map shows you where the experience falls short. The next step is to turn one of those pain points into a design you can test.
Start by picking an opportunity, map the steps a user needs to take inside the product, and design screens that support those steps.
Once users try the flow, their feedback can help you refine the design and update the original map. That's how the customer journey mapping process moves from identifying problems to making actual product improvements.
GOV.UK One Login shows how this works in practice. Its documentation includes two user journey maps for services adopting One Login, with links to the screens in Figma that deliver each step.
In Option 1, users create their One Login account at the start, then return to the service they want to use. Option 2 lets them begin the service journey first and create an account later if they want to save their progress. Both journeys have been tested with users.
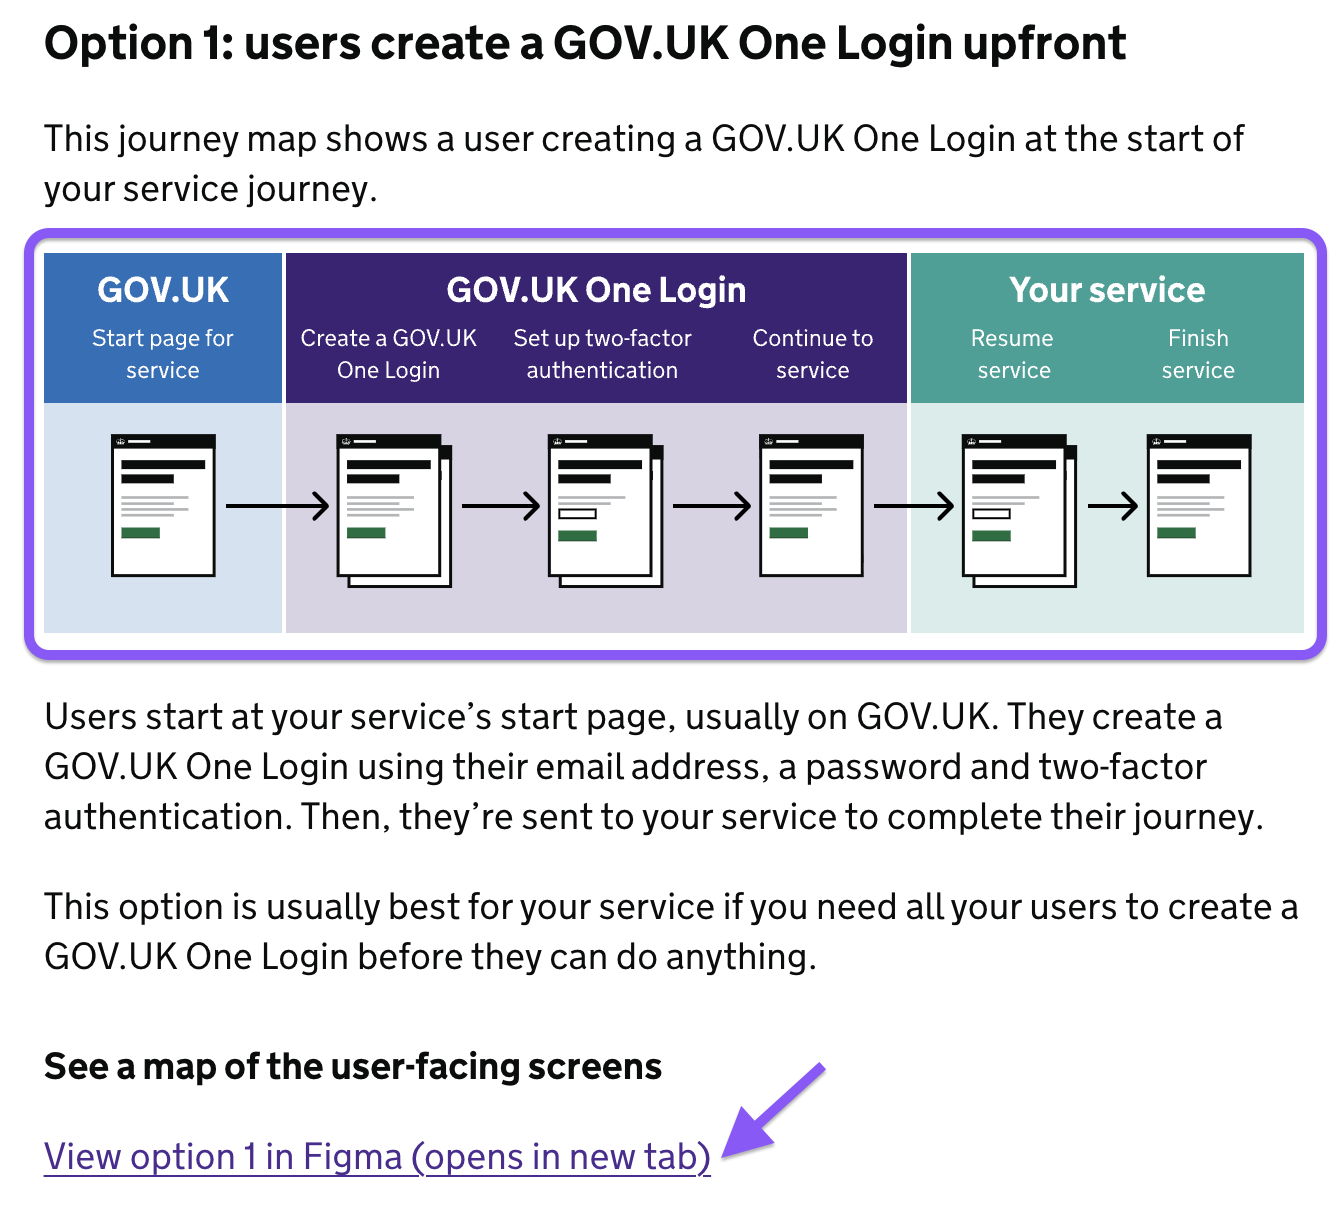
The linked prototypes make the example especially useful. You can see how a documented journey translates into actual screens, rather than stopping at a visual representation of the intended experience.
I tried the same approach with my Asana journey map. One opportunity I identified was making the first action in the workspace clearer.
To explore a possible fix, I mapped a short flow for a new user:
- Open the workspace.
- Find where to start.
- Create and name a project.
- Add a task.
- View the finished project.
I used UX Pilot's Autoflow to turn that proposed experience into connected screens. Instead of designing each screen separately, I could describe the problem, outline the steps, and generate an initial flow to review.
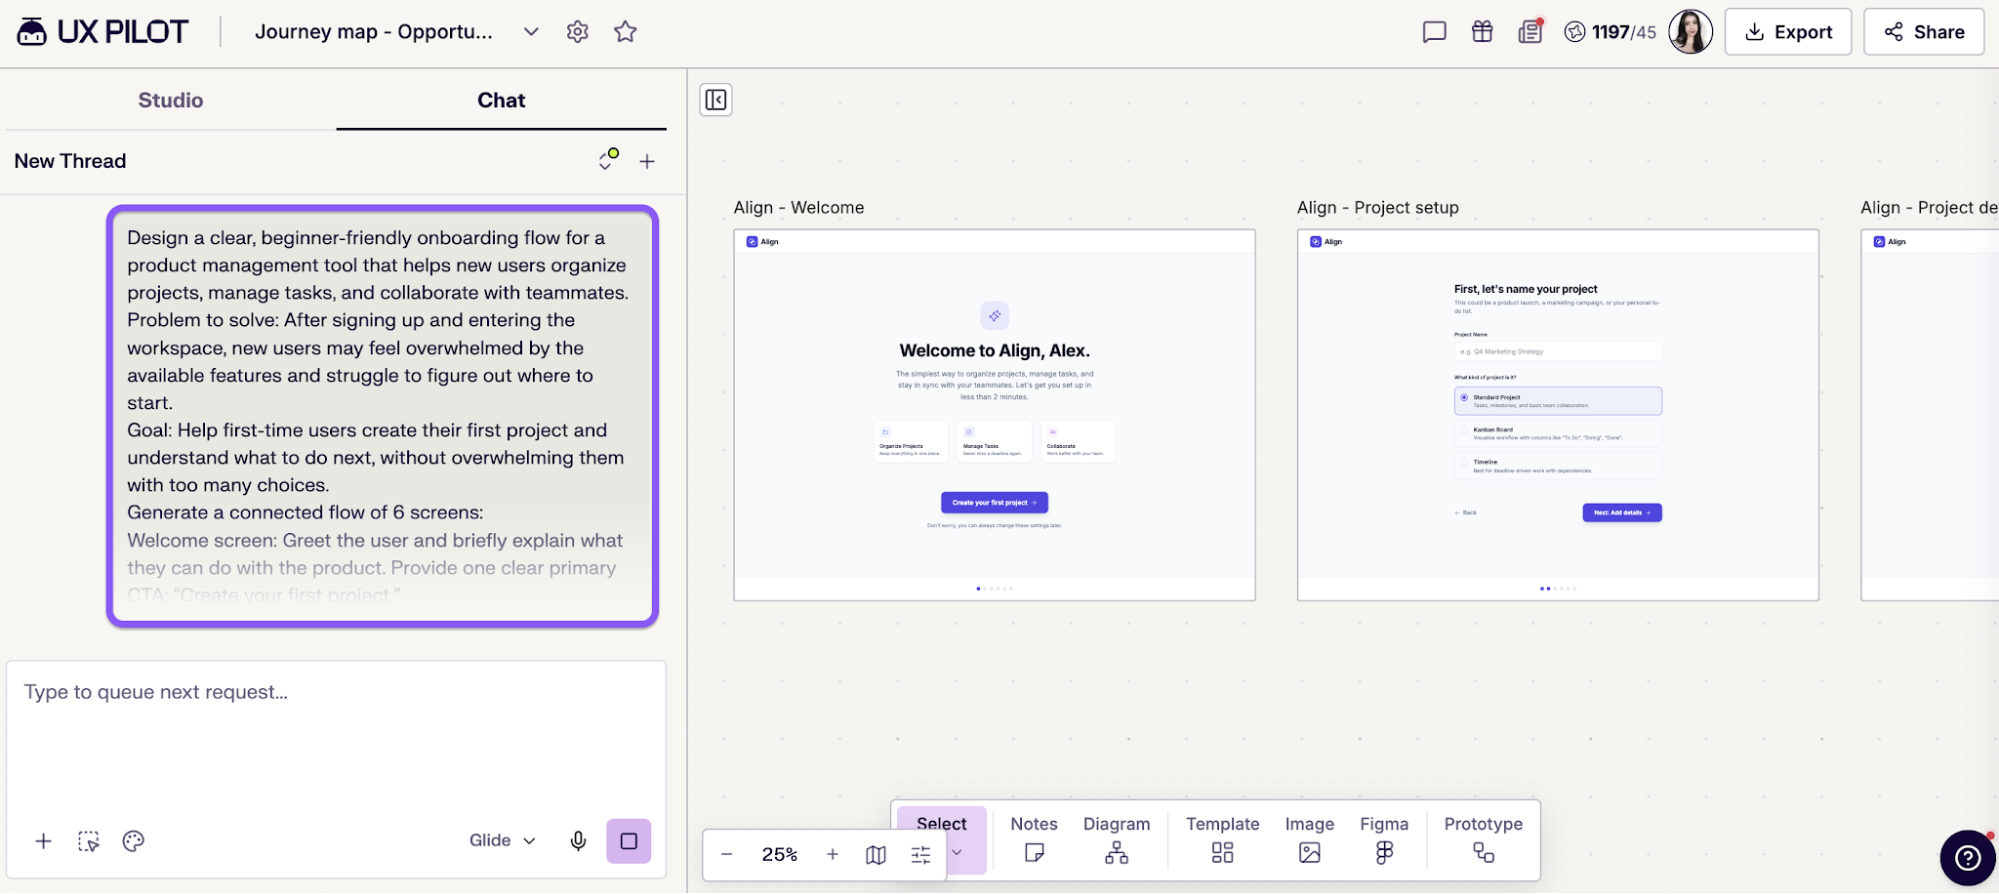
For this example, I made sure the prompt I used focused on describing helping new users find their starting point and create their first project. The generated screens gave me a starting point for refining the sequence and checking whether each step made sense.
This is where UX Pilot can help product teams act on customer journey insights.
You can take an opportunity from your research, generate a user flow, and refine the screens before testing the proposed solution with users. Their feedback can reveal remaining pain points and help you decide whether the original opportunity needs to change.
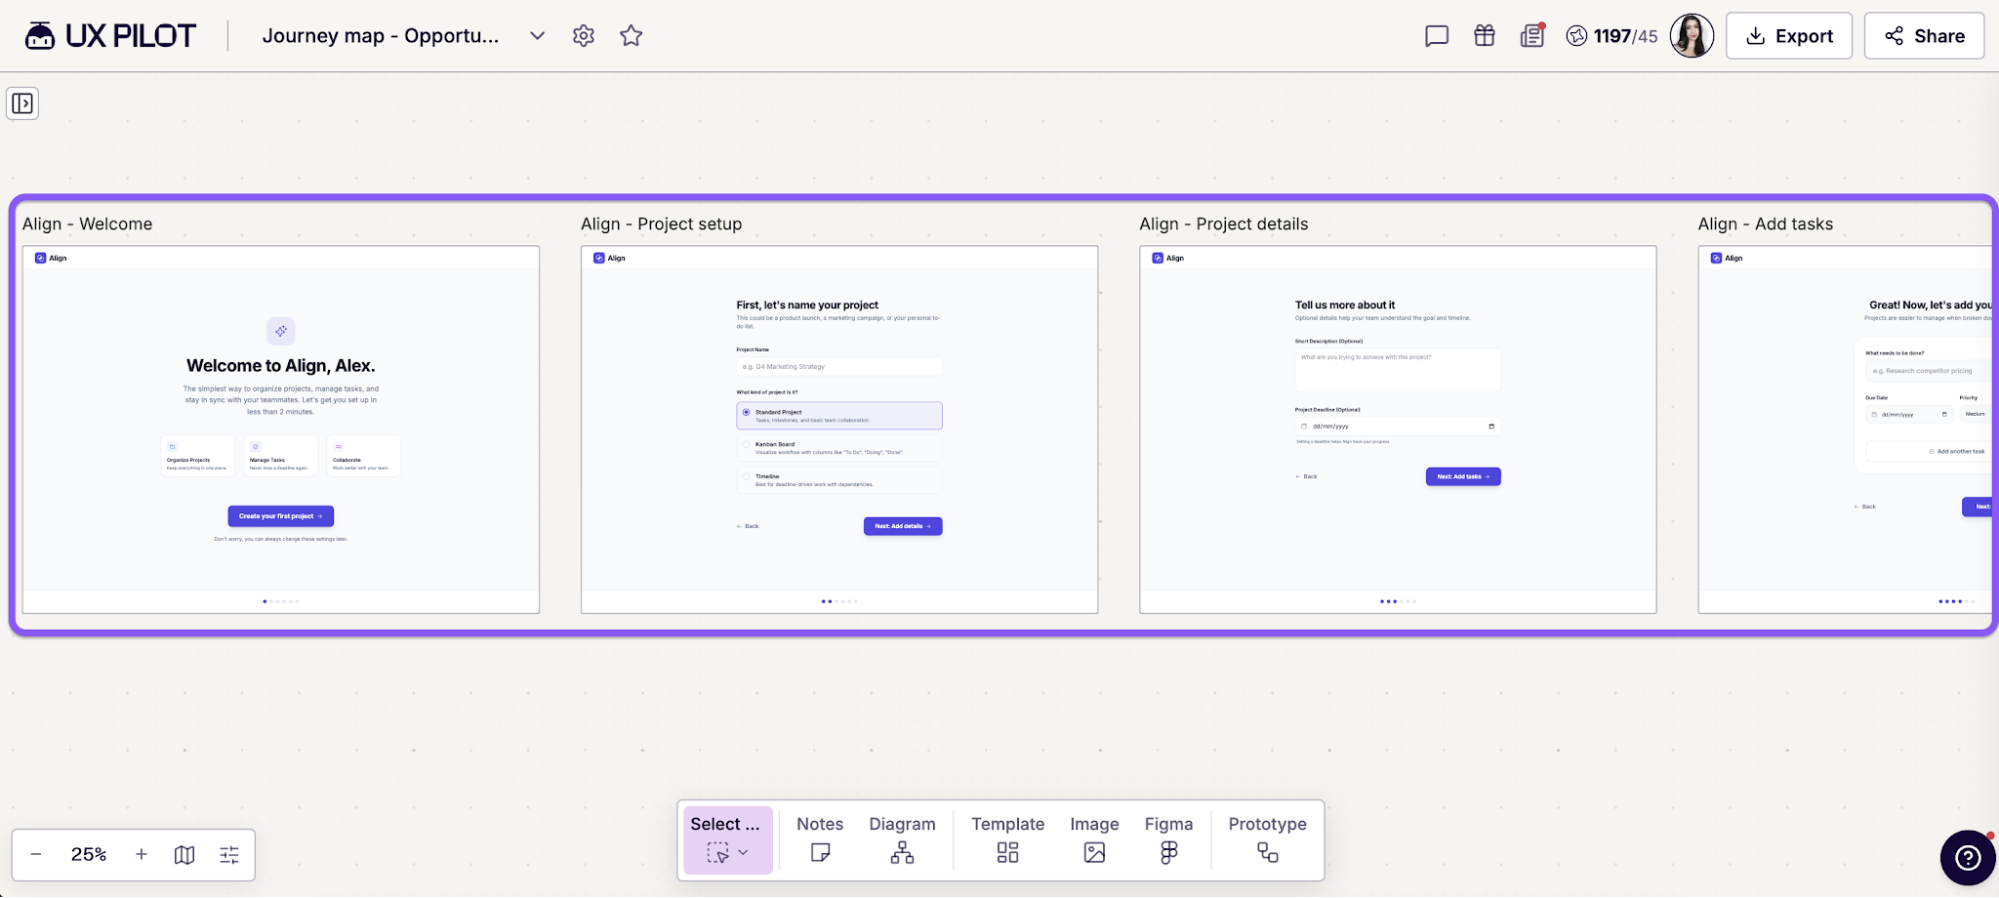
If you want to try this with your own map, UX Pilot's Autoflow user flow generator generates connected screens from a prompt. It gives you a practical starting point for testing a proposed fix without having to design every screen from scratch.
Can AI build a customer journey map for you?
With AI, you can easily create user journey maps using the customer experience research you've collected.
It can organize customer touchpoints, spot recurring pain points, identify opportunities, and suggest improvements for your buyer's journey. But it can also make assumptions about what customers think and feel. The key is to use AI to organize real evidence, then check its findings before acting on them.
Research shows that AI can identify customer needs, but results depend on the model.
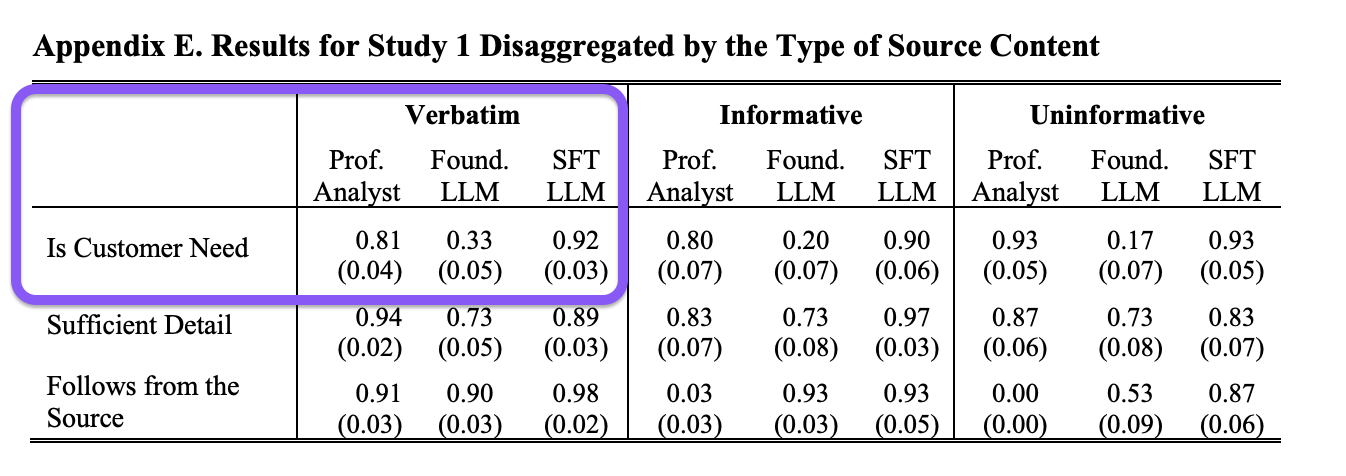
In a study of wood stain reviews, Timoshenko, Mao, and Hauser found that 92% of statements from a fine-tuned model were valid customer needs, compared with 81% from professional analysts. An off-the-shelf model performed significantly worse than the analysts. The study is a preprint and didn't examine software journeys.
And another 2025 Journal of Marketing study by Arora, Chakraborty, and Nishimura found that teams combining AI with human researchers outperformed AI-only and human-only teams on qualitative research tasks.
In short, this means AI is great for organizing customer feedback and spot patterns, but always verify its findings against the original evidence. Keep in mind, neither study directly tested AI-generated software journey maps.
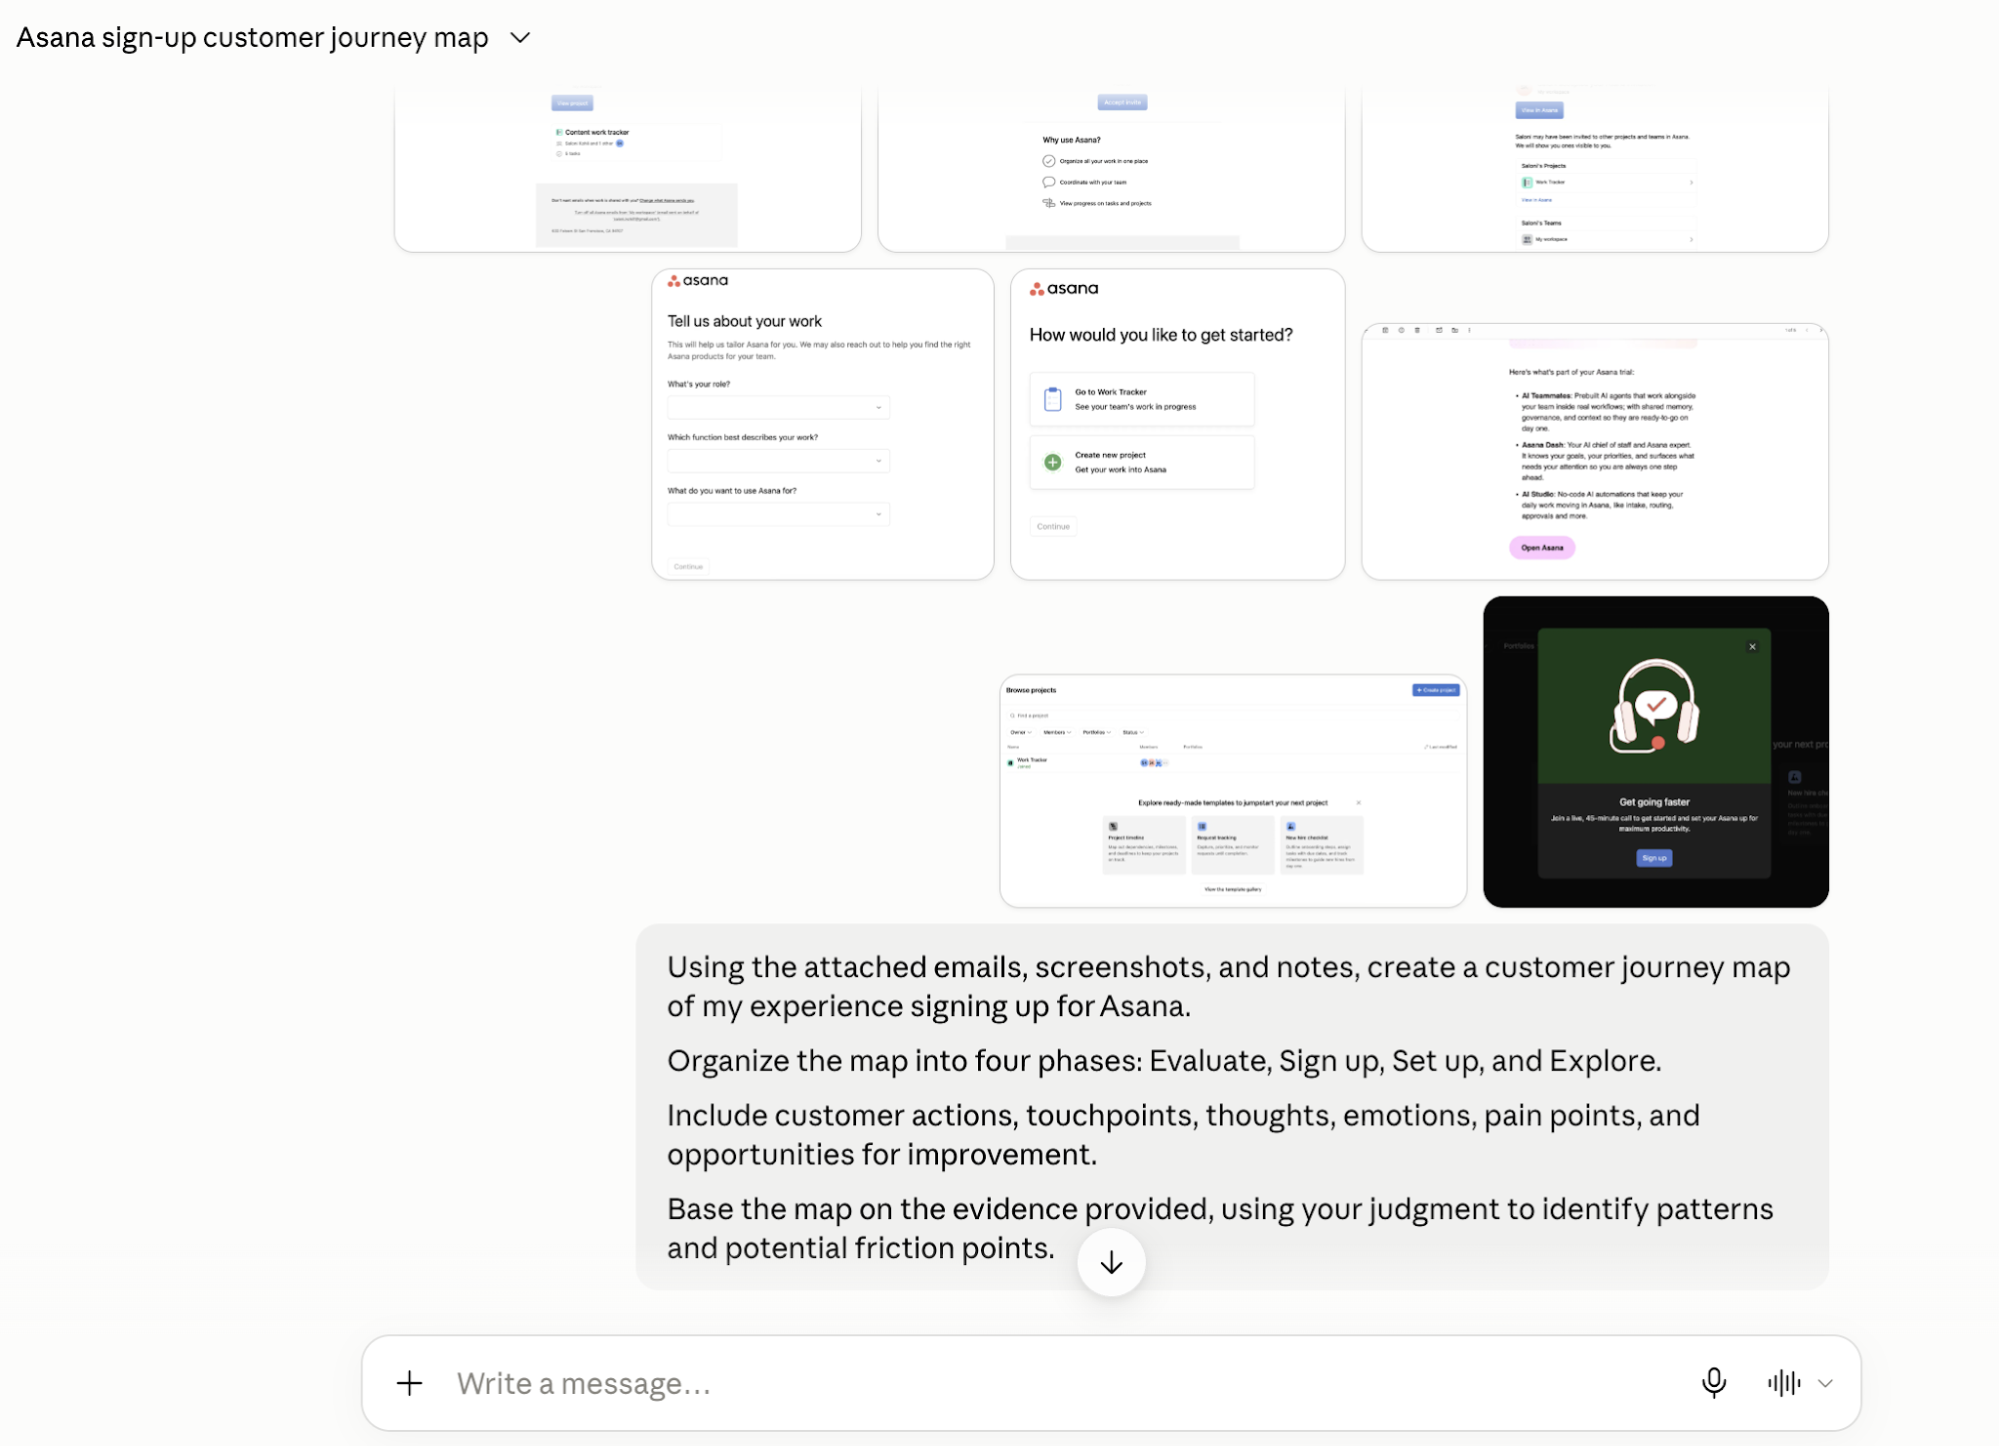
That's why I tested this using my own Asana sign-up experience by giving Claude the emails, screenshots, and notes I had collected throughout my user journey and asked it to create a customer journey map.
Claude picked up on useful details, including two invitation emails with different calls to action and inconsistent project naming across team members. It also suggested making the next step clearer for new users.
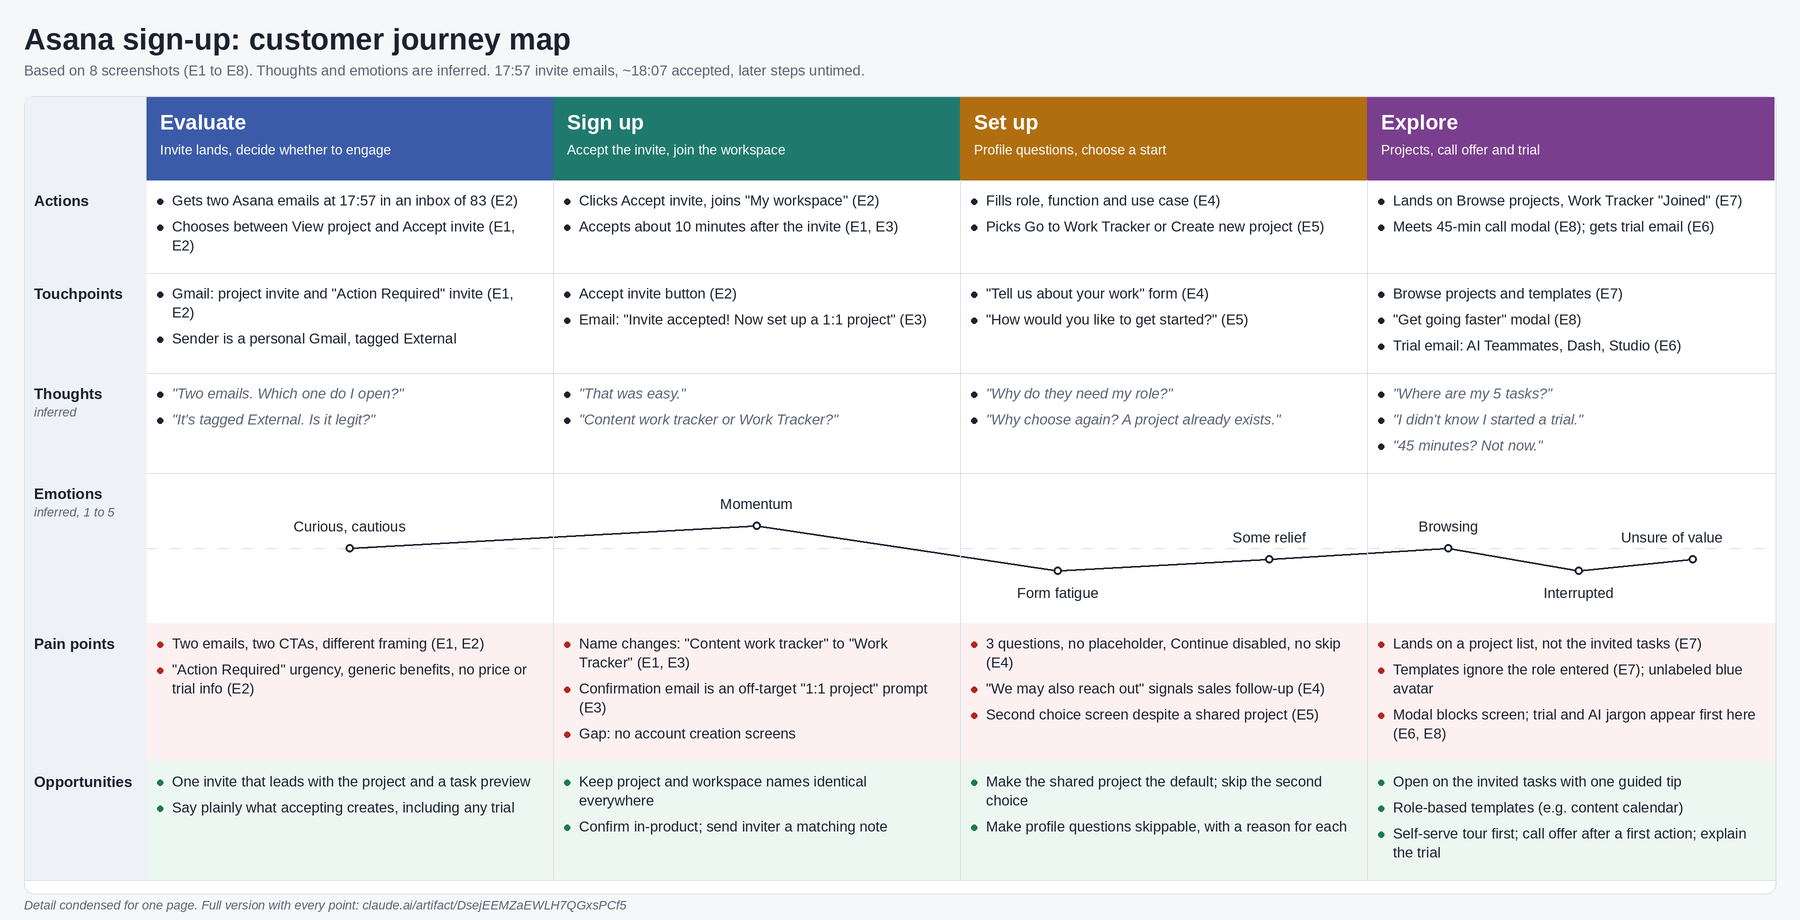
But not every observation was supported by evidence. Claude inferred that I might question whether an invitation was legitimate, even though I hadn't reported feeling that way. It was a plausible guess, not a confirmed customer insight.
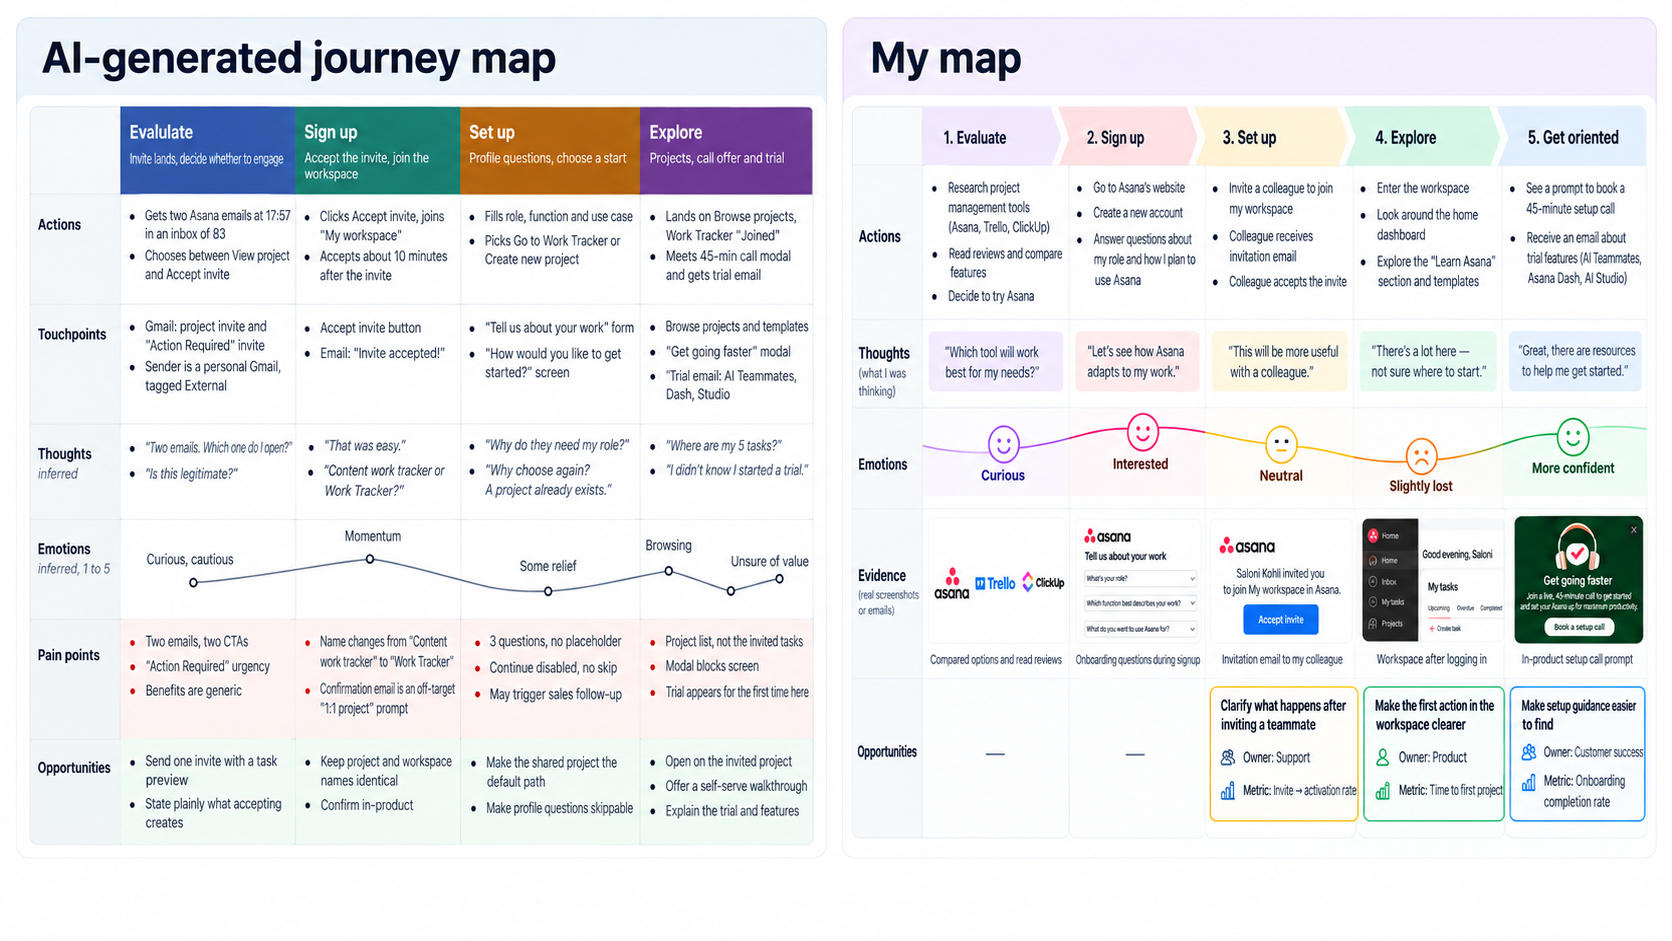
Again, AI is great for organizing research and identify potential improvements, but don't let it invent the customer's experience without real evidence. Check each finding against the original source, and treat inferred thoughts and emotions as hypotheses until you've validated them with customers.
And always remember that customer journey mapping should involve continuous iteration based on feedback and changing customer needs.
Keeping a customer journey map tied to product decisions
A customer journey map is only worth keeping if it changes what the team decides. In my Asana map, the most useful part wasn't the timeline itself. It was the three opportunities, each with an owner and a metric, and the user flow I could put in front of users.
To keep your map tied to product decisions, review it when a metric attached to one of its opportunities moves, when you ship a fix, or when new research shows that customer needs have changed. Update the current-state map with what actually happened, close the opportunities that are done, and add the pain points the latest research surfaced.
If no product decision has referenced the map in a quarter, the scope is probably too broad or the owners aren't using it. Fix that before you map a new journey.
Key takeaways
- Start every customer journey map with the decision it should inform, one persona, and one scenario.
- Build the map from customer research, and weight touchpoints by how many customers actually meet them.
- Give every opportunity an owner and a metric, because the owner is often outside the product team.
- Turn one opportunity into a user flow and screens, test them, and update the map with what you learn.
- Use AI to organize real evidence, and treat any thoughts or emotions it infers as hypotheses.