

A user journey map is a visual representation of the steps a user takes to achieve a specific goal within your product, including what they do, think, and feel along the way.
For product teams, it's a way to understand the experience before jumping into solutions. You might know where users drop off, but a journey map helps you investigate what happens leading up to that point, where they get confused, and what you can improve.
But how detailed should your map be, and where do you start? I'll walk you through how user journey maps differ from customer journey maps and user flows, five steps to build one, and three real examples you can learn from.
What is a user journey map?
A user journey map is a visual representation of how a specific user moves through your product to achieve a goal. It focuses on one persona and one scenario, with a clear starting point, an endpoint, and the phases in between.
At each phase, the map captures what the user does, thinks, and feels, along with any pain points they encounter. It also highlights opportunities to improve the experience.
For example, you could map how a new user goes from signing up for your SaaS product to completing their first project, including where they get confused or need help.
According to Nielsen Norman Group (NN/g), a user journey is:
A scenario-based sequence of the steps that a user takes in order to accomplish a high-level goal with a company or product, usually across channels and over time.
You might see the terms user journey map and customer journey map used interchangeably. NN/g's Journey Mapping 101 defines a single artifact, the journey map, around a generic actor, with no separate user and customer versions. In this article, I use user journey map for a journey scoped to one product, but there's no strict line between the two.
A typical map includes an actor, scenario, journey phases, actions, thoughts, emotions, and opportunities. You can find a more detailed breakdown of these elements in UX Pilot's customer journey map guide.
There are also different types of journey maps depending on what you're trying to understand. For example, the UK's Government Digital Service (GDS) describes three types:
- a hypothetical as-is map to identify assumptions and plan research,
- a research-based map to document the current experience,
- and a to-be map to visualize the desired experience and guide a redesign.
The first two are what most teams call a current-state map, and the third is a future-state map.
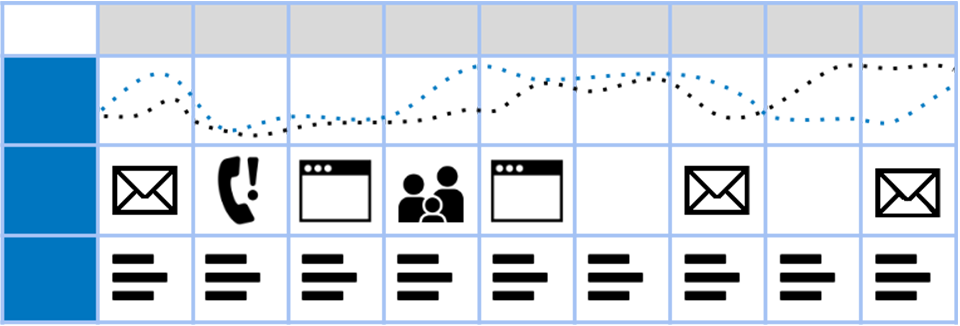
The example below from GDS shows how users move through different touchpoints, including emails, phone calls, and websites, while the dotted lines visualize how their experience changes at each stage.
What is the difference between a user journey map, a customer journey map, and a user flow?
The main difference between a user journey map and a user flow is that a journey map shows what one user does, thinks, and feels across phases on the way to a goal, while a user flow shows only the screens, actions, and system responses for one task. A customer journey map is wider still: it covers the whole relationship with a company.
A customer journey map takes a broader view of someone's relationship with a company, from discovering its products to purchasing, getting support, and renewing. In practice, user and customer journey maps overlap, and teams often use the terms interchangeably.
As NN/g explains, user journeys zoom out to consider multiple touchpoints and channels, while user flows zoom in on interactions within a single product. Journeys can span days, weeks, or months, whereas flows typically take minutes or hours at most.
Here's how I'd distinguish the three when working on a product:
| Artifact | Scope | Timeframe | Includes emotions? | Best used for |
|---|---|---|---|---|
| Customer journey map | Entire relationship with a company across channels | Days to months or longer | Yes | Understanding the end-to-end customer experience |
| User journey map | One user goal within a product | Days to weeks, depending on the goal | Yes | Identifying friction and opportunities across product experiences |
| User flow | Screens, actions, decisions, and system responses for one task | Minutes to hours | No | Designing and optimizing specific task paths |
For example, if users struggle to complete onboarding, I'd start with a user journey map to understand where they get stuck and why. Once I've identified the problem, I'd create a user flow to work through the screens and interactions that need improvement.
If the problem extends beyond the product, such as how customers discover, purchase, and receive support, a customer journey map would be more appropriate.
How to make a user journey map
To create a user journey map, start with one user and one goal, then work through the steps they take to achieve it. Here's how I'd approach it:
- Pick one persona, one goal, and the scope of the journey.
- Gather research on what users actually do in your product.
- Map each action in order, then group the stages into phases.
- Add user thoughts, emotions, and pain points, then prioritize the worst moment and the end.
- Turn the biggest pain point into a user flow and identify opportunities to improve the experience.
This process is adapted from a user journey mapping workshop method developed by Endmann and Keßner across seven client projects and published in i-com in 2016.
1. Pick one persona, one goal, and a start and end point
Before mapping anything, decide whose experience you're looking at and what they're trying to accomplish. I'd recommend sticking to one persona and one goal per map, even if your product serves several types of users.
Your scope should answer four questions:
- Who: Which user persona are you mapping? If you haven't defined one, start with our UX persona examples.
- Goal: What does the user want to achieve?
- Start: What triggers them to begin the journey?
- End: When do they achieve their goal or give up?
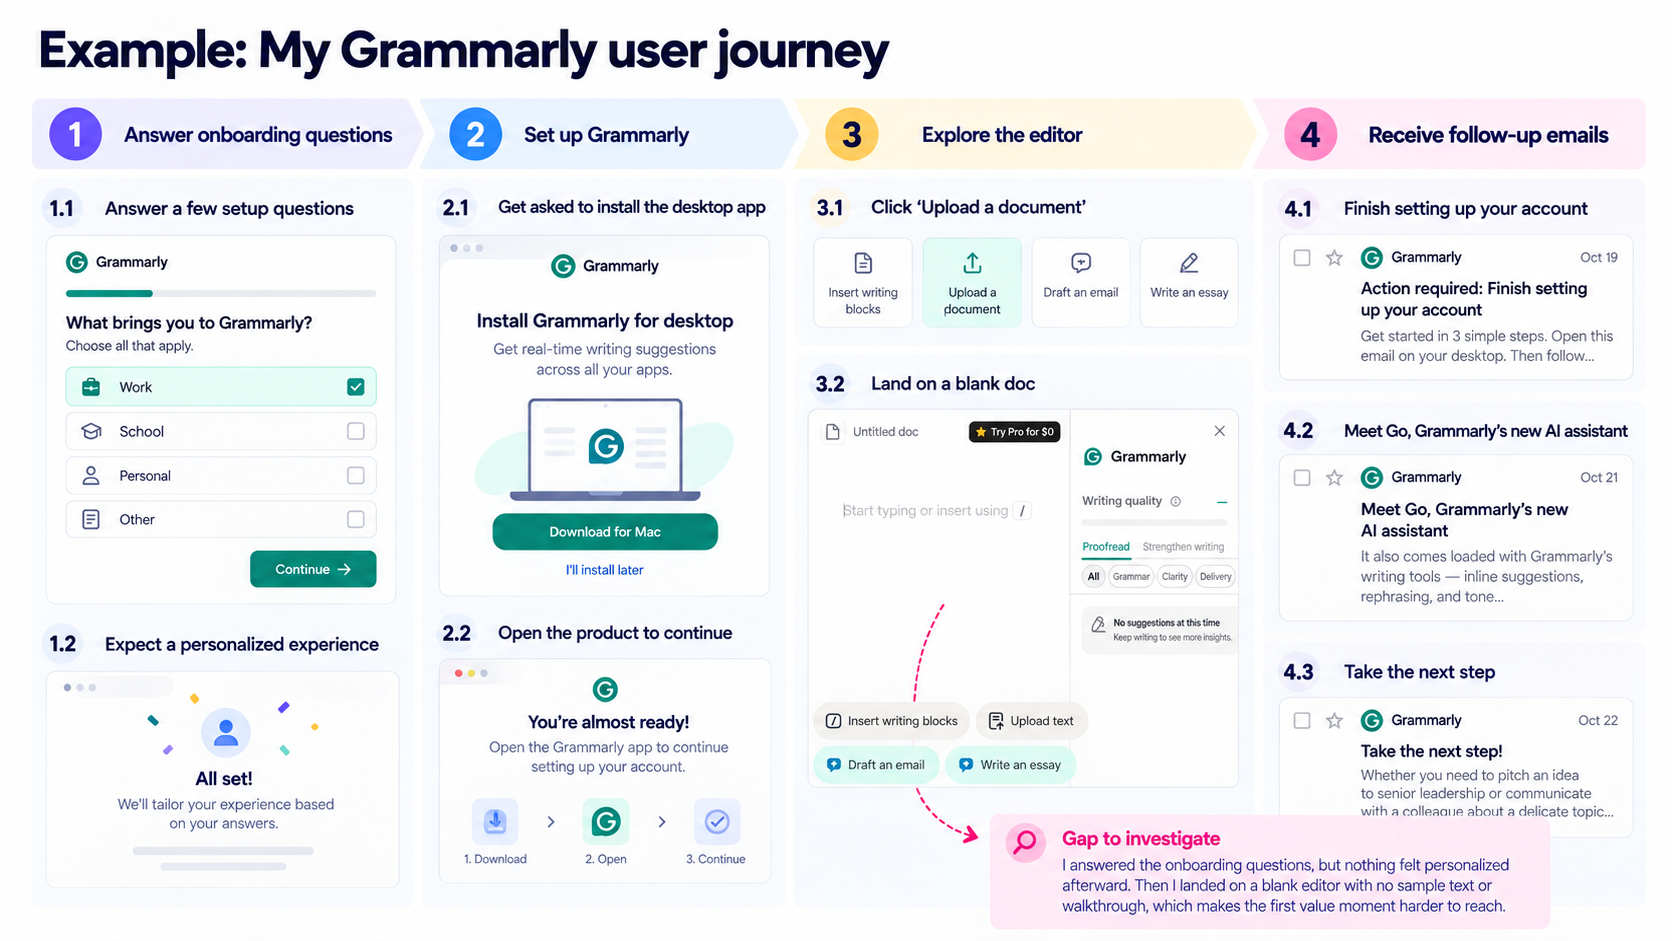
For example, when I signed up for Grammarly, I answered a few onboarding questions about how I planned to use the product.
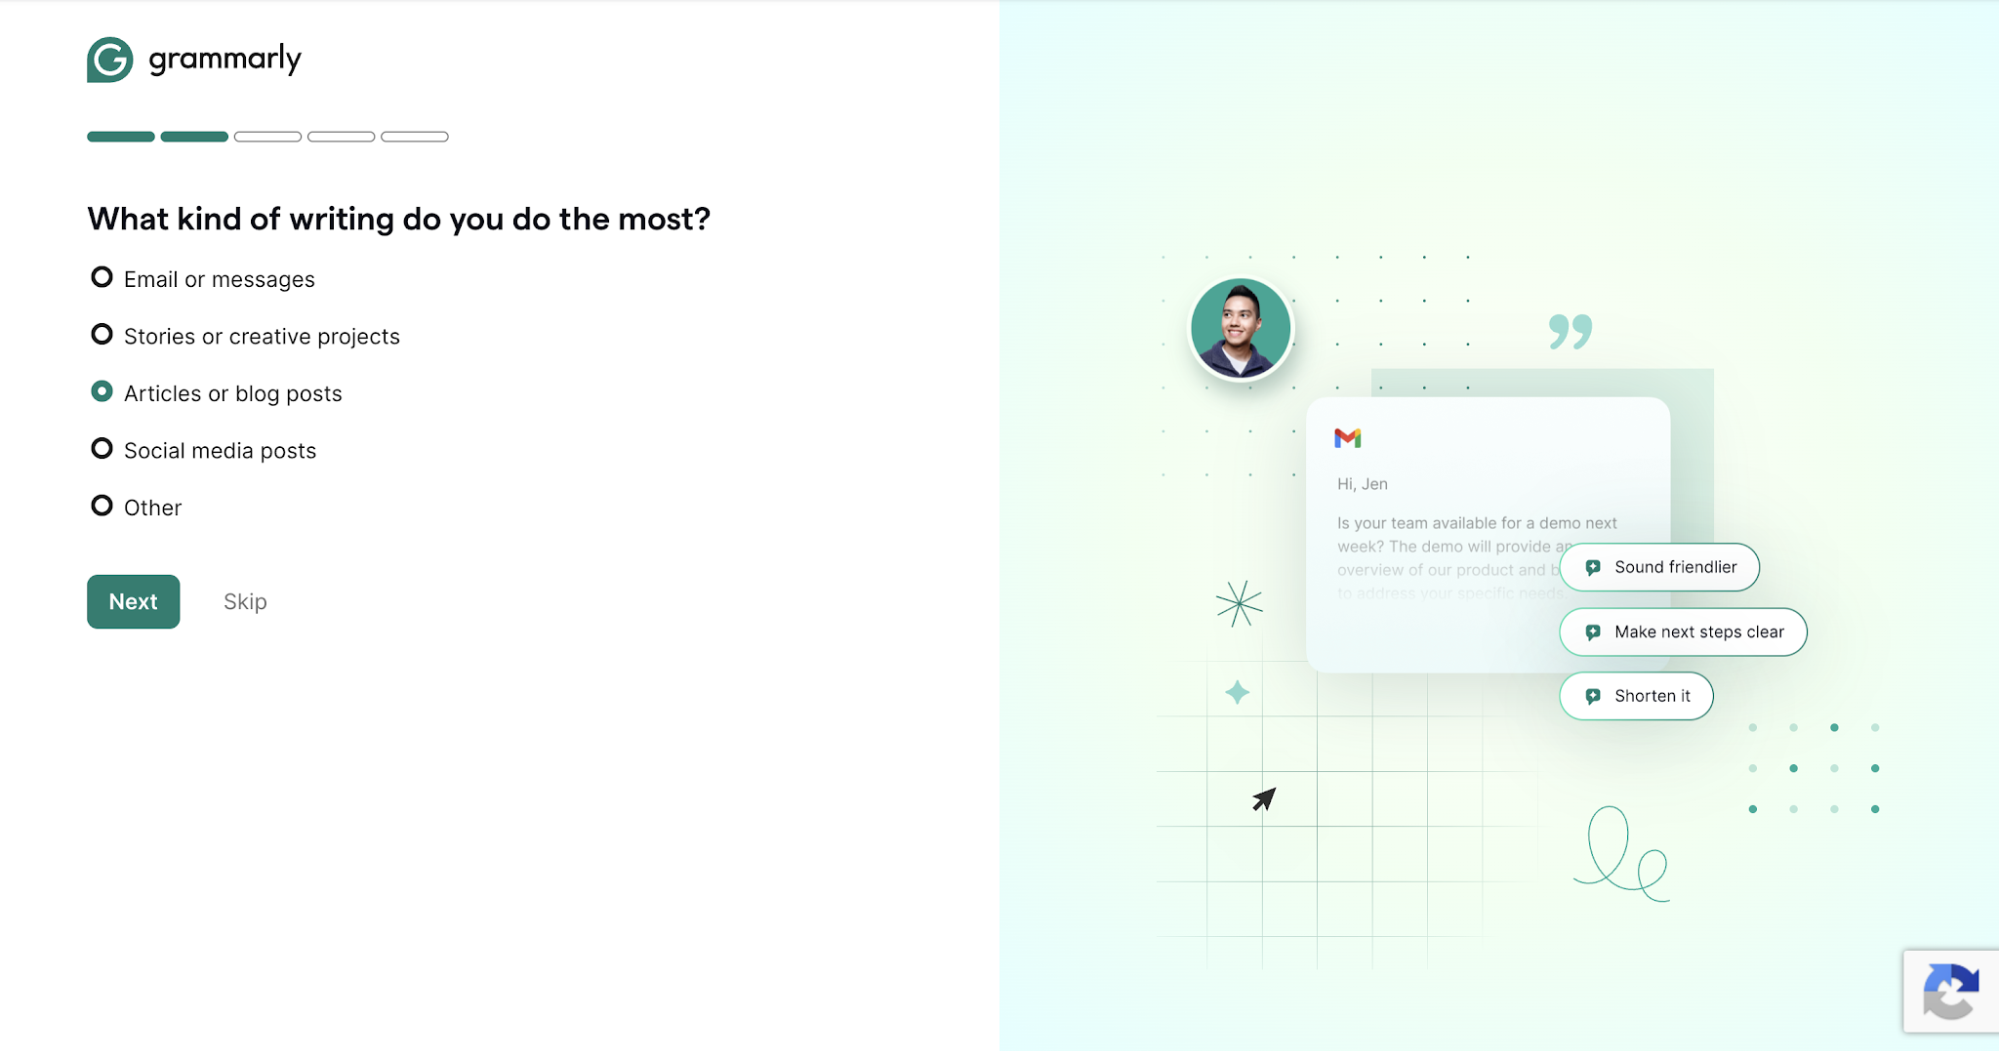
I expected a somewhat personalized experience based on my answers, but the next screen asked me to install the desktop app.
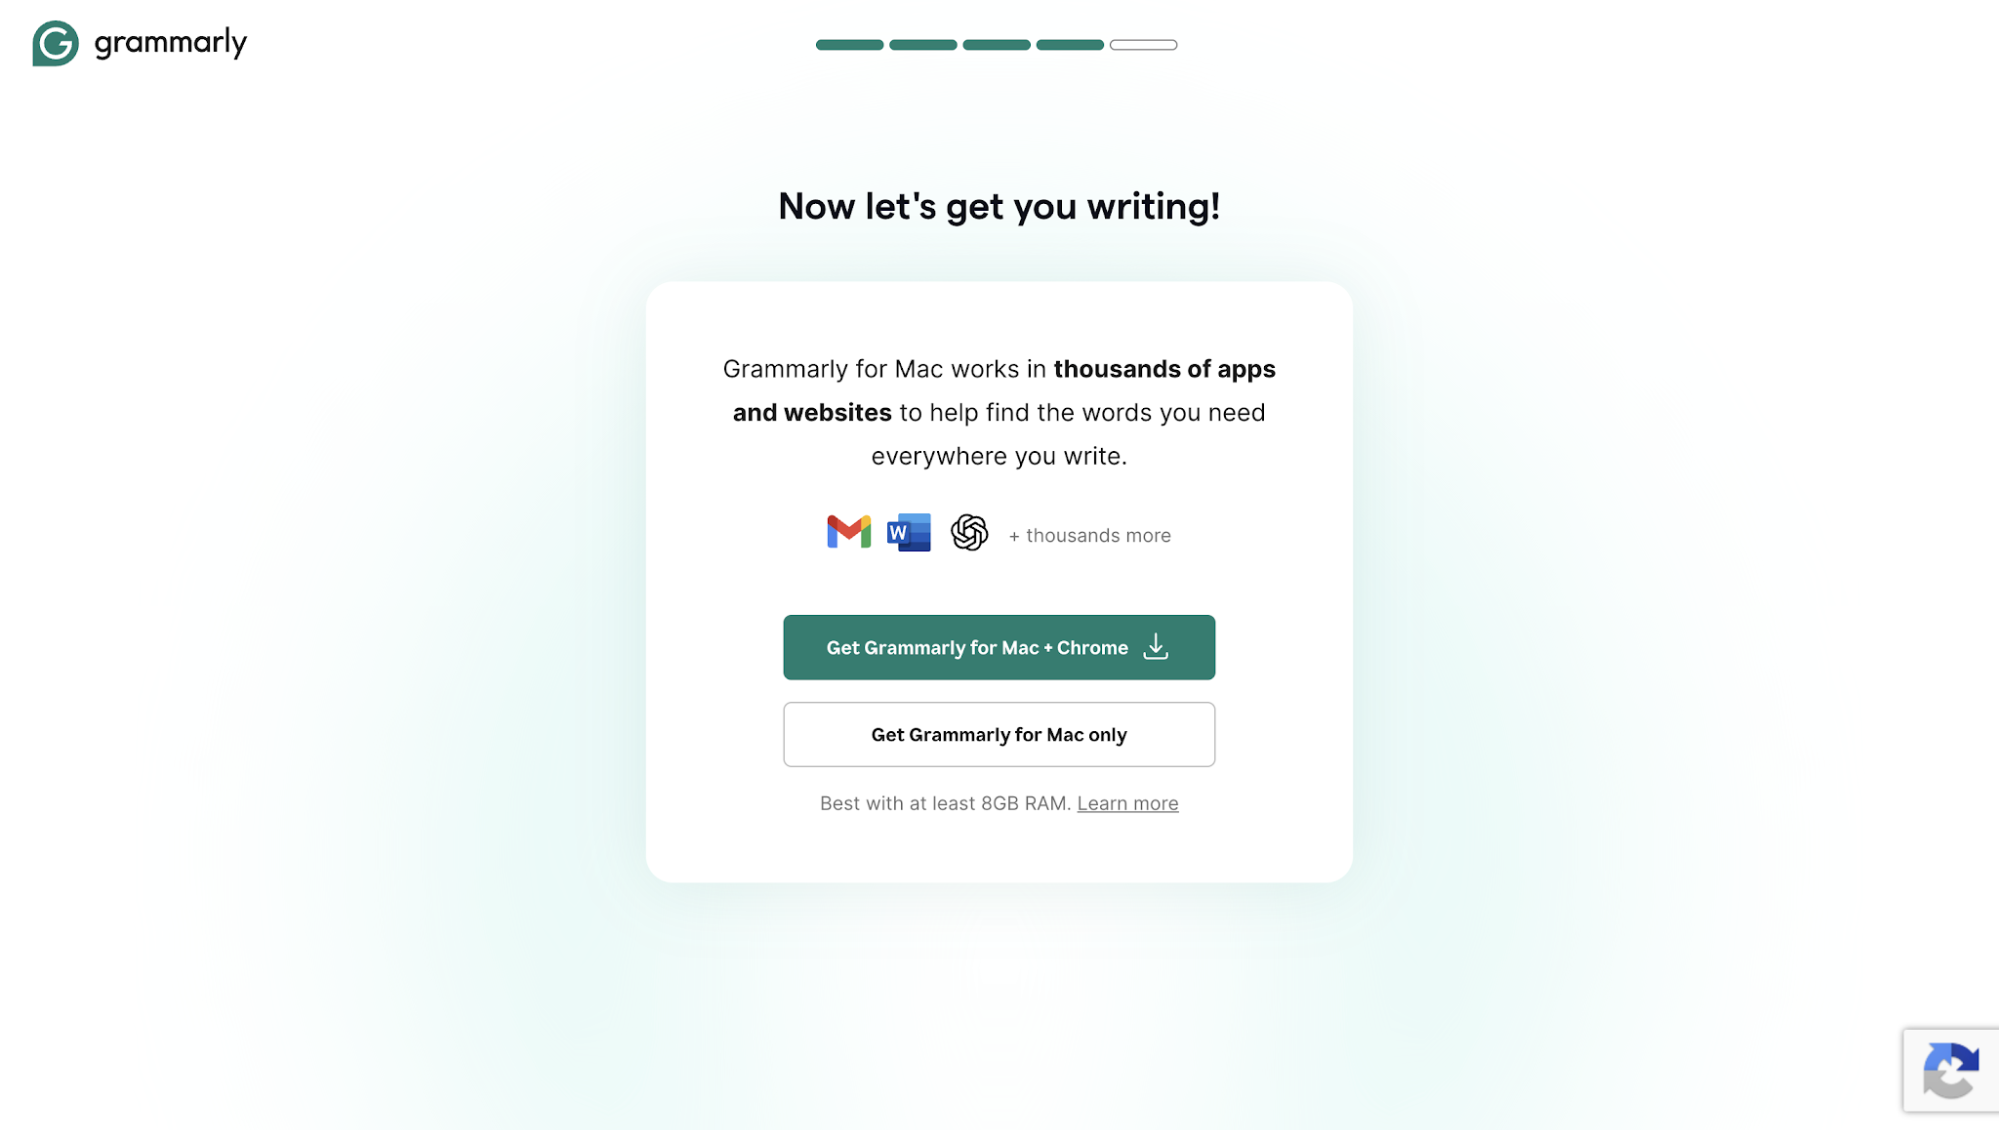
What caught my attention was that Grammarly wanted me to install something before I'd even experienced its value. So, for this journey map, I set the start point at signing up and answering the onboarding questions, and the end point at receiving the first useful writing suggestion or abandoning the process.
The installation step is particularly worth investigating. Would new users be willing to download an app before seeing what it can do for them?
2. Collect what users did, not what the team thinks they did
I'd start with whatever user research and behavioral data you already have, including:
- Usability test recordings to observe where users hesitate or struggle.
- Session analytics to identify drop-offs, repeated actions, and unexpected navigation paths.
- Onboarding interviews to understand users' expectations and decisions.
- Support tickets and in-app feedback to uncover problems users have reported themselves.
For example, when Atlassian researched its Automation feature, customer interviews revealed that users struggled with smart values and frequently had to leave Jira or Confluence to search for documentation. Further analysis found that over 10% of Automation support tickets were related to smart values. These findings helped the team prioritize and design a searchable help panel directly inside the product.
But what if you don't have enough user research yet?
You can start with a hypothesis journey map, as suggested by the Government Digital Service. Sketch how you think users move through the product, then use that map to identify assumptions you need to test. Once you've gathered evidence, update it to reflect what actually happens.
Even a small study can surface surprises. At Reed College Library, researchers asked seven students to sketch how they find a book, and the sketches revealed navigation problems the staff hadn't expected. I'll come back to this example below.
3. Write each step in order, then group steps into phases
Now, write down each user action on a separate note and arrange them in chronological order. Following Endmann and Keßner's approach, you can then group related activities into broader phases and look for gaps between them.
I recommend describing the steps in the user's own words, such as "looks for where to paste my email" instead of feature names like "opens document upload." This helps you follow what users are trying to accomplish.
Going back to my Grammarly example, I answered a few onboarding questions, only to be directed to install the desktop app. When I opened the web app, there was little guidance either. Clicking "Upload a document" took me to a blank editor, with no sample text or walkthrough to help me get started.
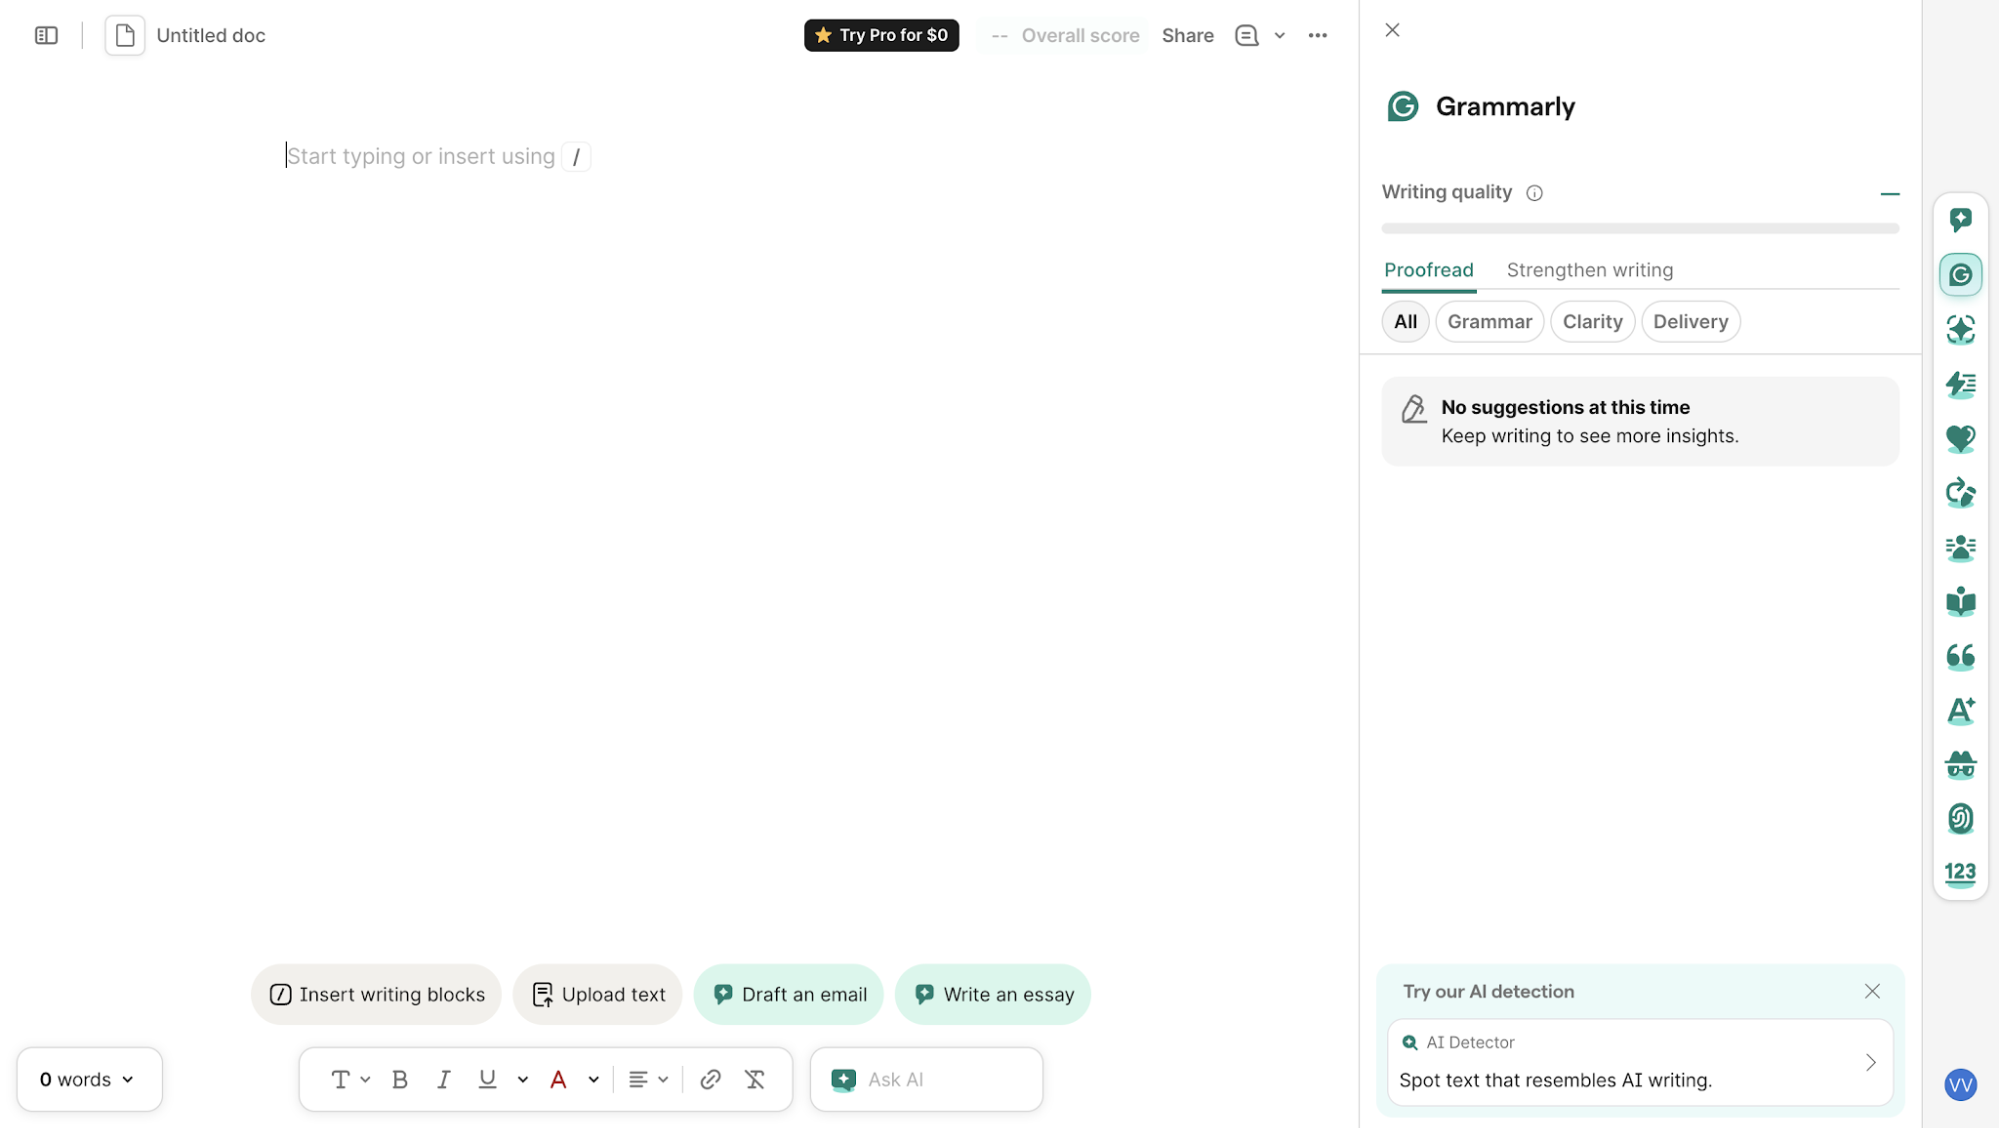
Over the next few days, Grammarly sent onboarding emails introducing its features and encouraging me to complete the setup.

I'd group this journey into four phases: Answer onboarding questions → Set up the app → Try the editor on my writing → Get follow-up emails.
What surprised me was how different this felt from two years ago, when Grammarly offered in-app guidance and a sample document. Maybe the brand is familiar enough that users already know what to expect. But I still question whether new users can reach their first value moment easily when there's so little guidance upfront.
4. Mark pain points and emotional peaks, and fix the worst moment and the end first
Continue to add the pain points and positive moments at each stage. Then draw an emotion line showing how users feel as they move toward their goal.
You can use what you've learned from interviews, usability tests, and user feedback to plot that line. Pay close attention to where frustration peaks, where users feel a sense of accomplishment, and how they feel at the end of the journey.
I'd say these moments are pretty important, as there's a psychological concept called the peak-end rule. It suggests that people tend to remember an experience based heavily on its most intense moment and how it ended.
In a randomized trial published in Pain in 2003, researchers Redelmeier, Katz, and Kahneman studied 682 patients undergoing colonoscopies. The researchers randomly assigned half of the patients to undergo a procedure extended by a few minutes of milder discomfort.
Despite the procedure lasting longer, these patients remembered it as less unpleasant.
| Retrospective evaluation | Standard ending | Gentler ending |
|---|---|---|
| Overall unpleasantness (0–10) | 4.9 | 4.4 |
| Aversiveness ranking (1–8) | 4.6 | 4.1 |
Among patients considered less likely to return for another colonoscopy, the return rate was also higher with the gentler ending (43% versus 32%).
Of course, this was a medical study, not a UX experiment. We can't assume that improving the last screen in an onboarding flow will produce similar results. But I think it's a useful principle for deciding where to focus your design efforts.
Start by looking at the lowest point on your emotion line and the final step of the journey. Fix those two before anything in the middle.
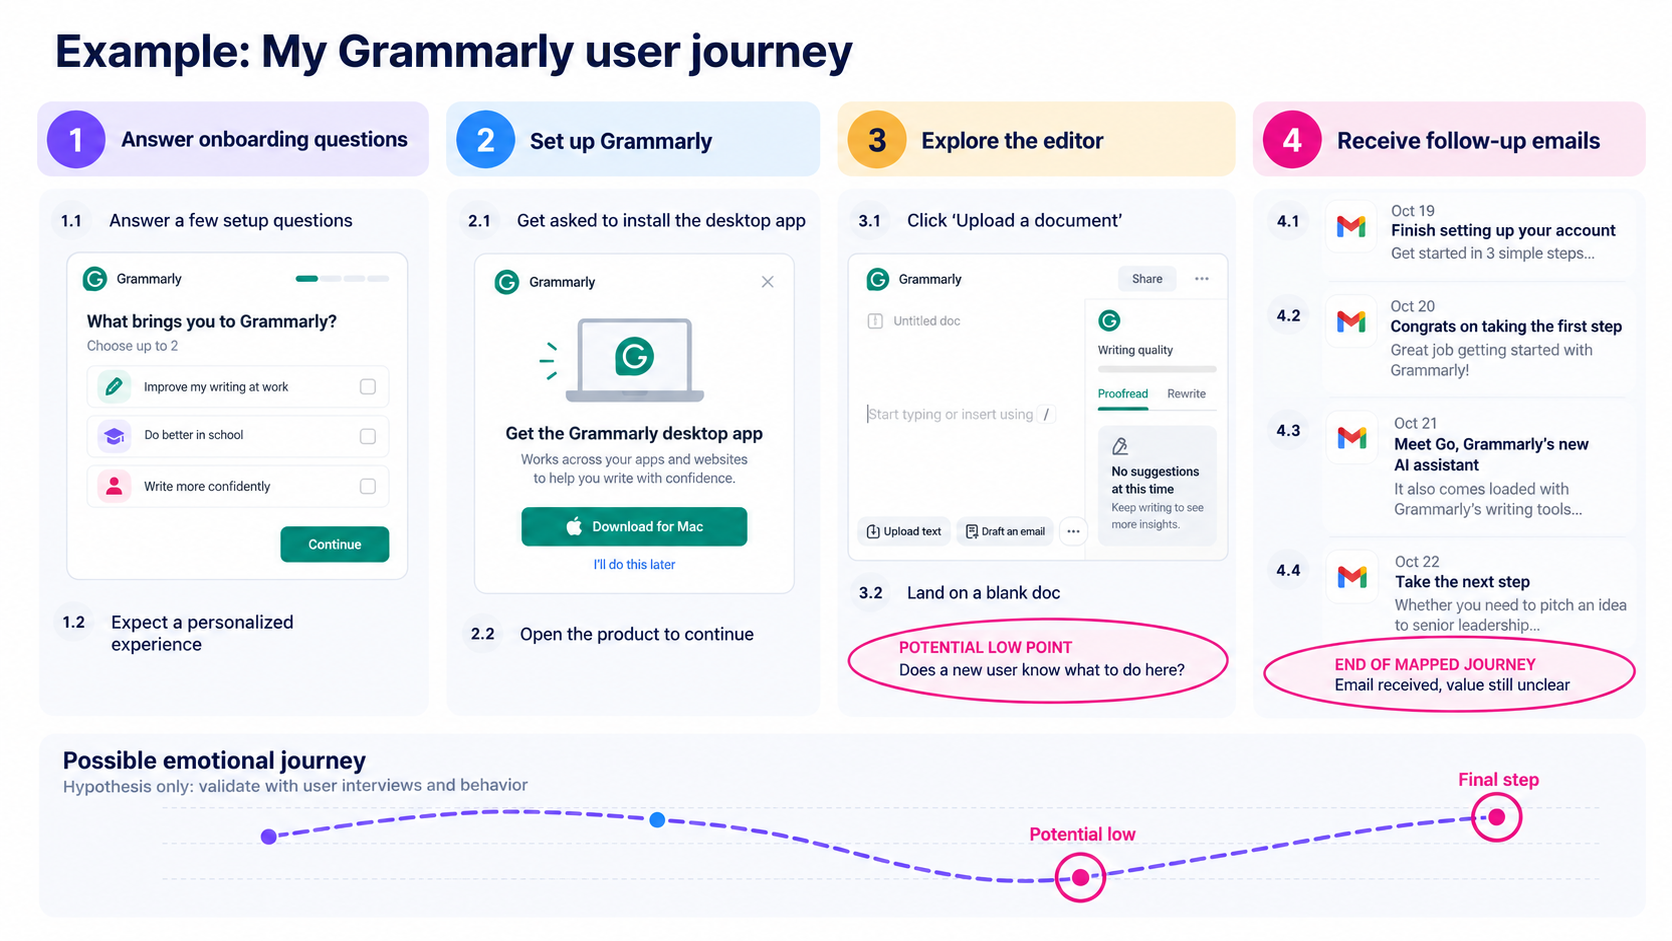
For my Grammarly map, I mark the transition from setup to writing as the potential emotional low point. The other moment worth circling is the final "Take the next step" email, which closes out the onboarding sequence.
Between the two, I think the first deserves more attention. Follow-up emails might encourage users to return, but if their first session hasn't given them a reason to stay, another reminder probably won't solve the problem.
5. Turn the biggest pain points into user flows
The next step is to pick one pain point and map out a better experience, including the screens users see, the actions they take, and how the product responds.
For Grammarly, I think it would be helpful to focus on helping users reach their first writing improvement faster. Since Grammarly already asks what they plan to use the product for, why not put those answers to work?
Here's a flow worth testing:
- Show a relevant example: After signup, Grammarly offers a sample work email or academic paragraph based on the user's onboarding answers.
- Demonstrate a writing improvement: The example opens in the editor with a grammar or clarity issue highlighted.
- Let users try it: Users review and accept a suggestion, immediately seeing how Grammarly improves the text.
- Move to their own writing: Grammarly invites them to paste or upload a document and try the same process.
I could design these four screens and test whether this approach helps users reach their first writing improvement faster than the current experience. More importantly, I'd learn whether personalization helps users get started or whether they prefer jumping straight into their own writing.
If you're mapping the experience with your team, UX Pilot's User Journey Workshop provides a ready-made format for the earlier steps.
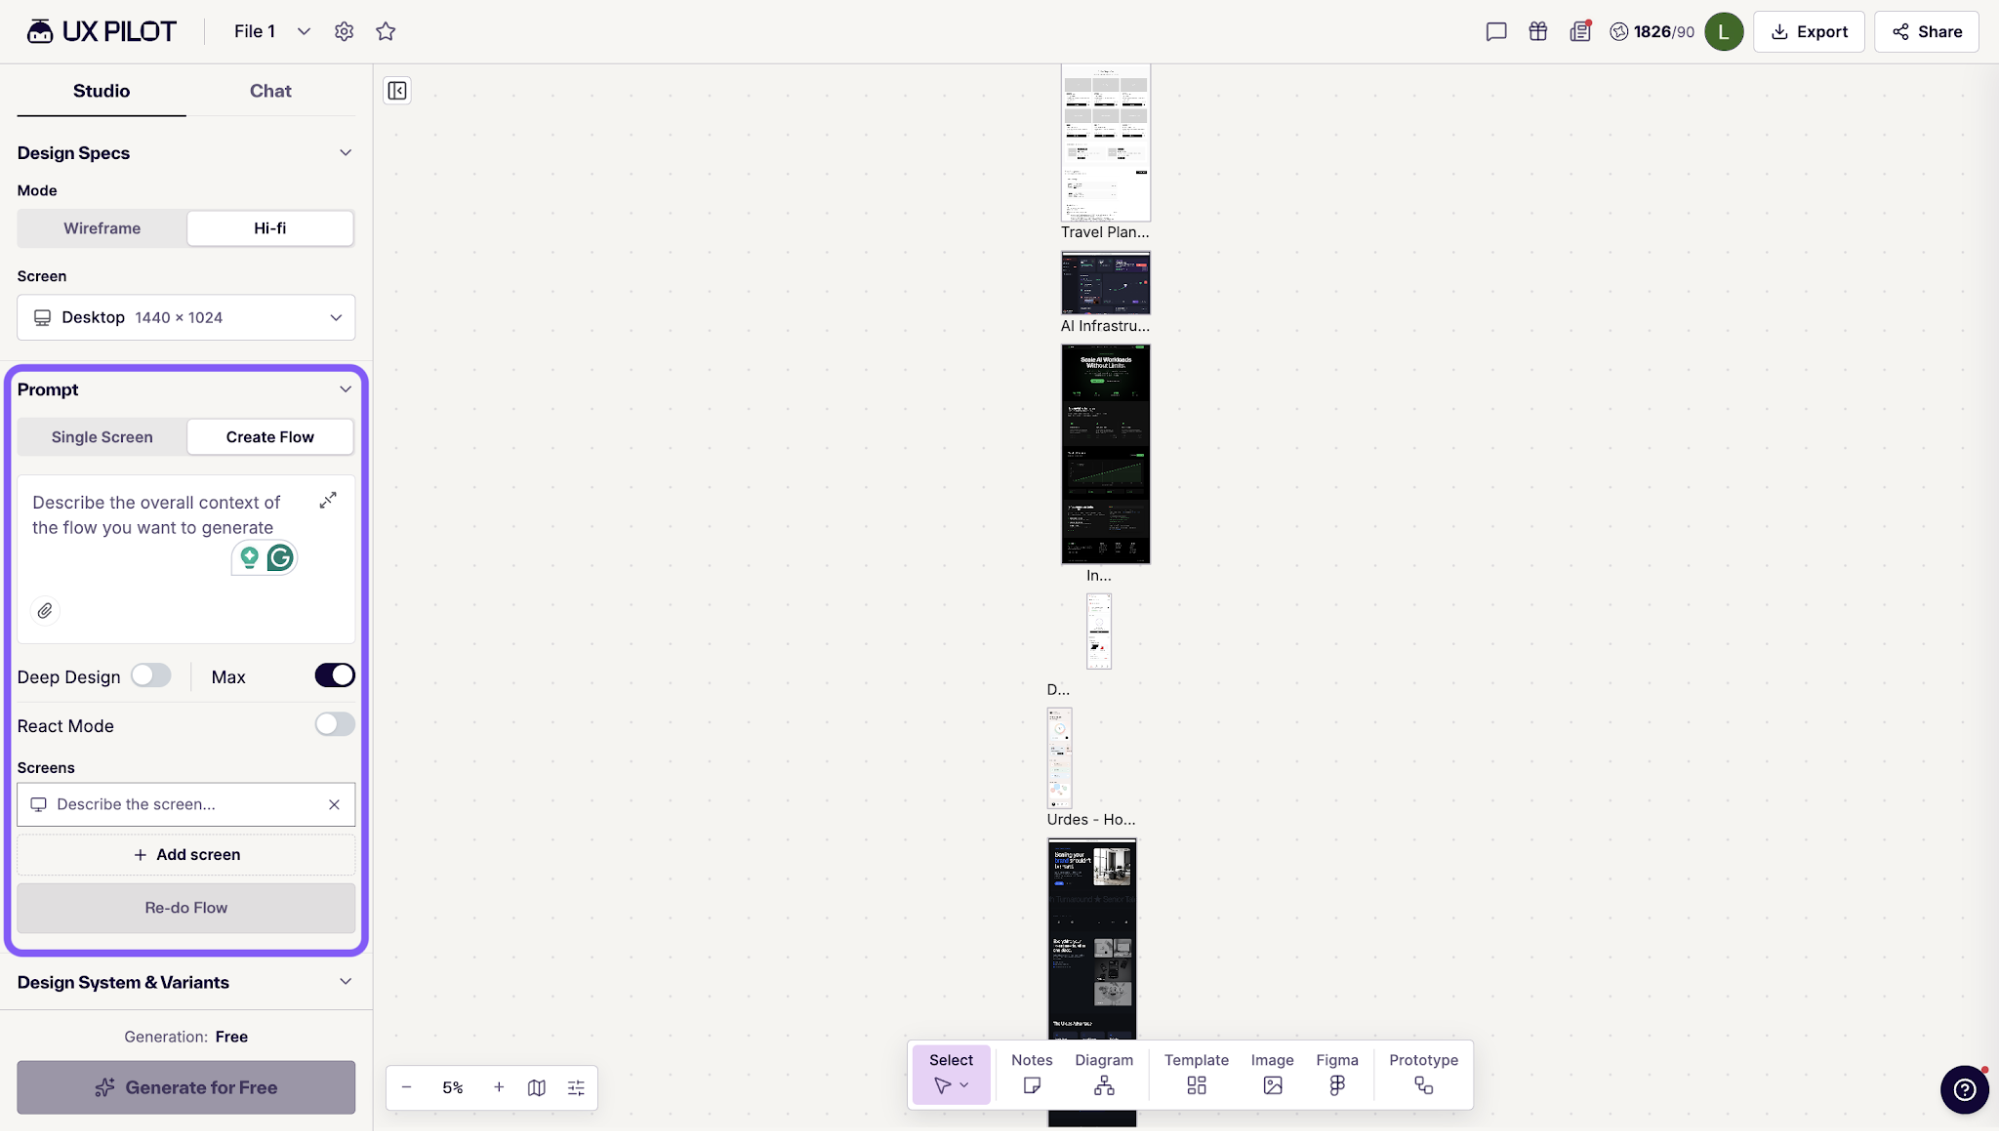
Once you've identified a problem worth solving, Autoflow can generate connected screens from a description of your proposed flow, giving you a prototype to refine and test with users.
That's how I'd turn the four Grammarly steps above into something clickable to test.
User journey map examples
To give you a better idea of how journey mapping works in practice, let's look at three examples from different industries.
- Reed College Library mapped how students find a book, following their experience from searching online to locating it on the shelves.
- GOV.UK One Login published journey maps alongside its interface designs, showing how individual screens fit into the larger experience.
- An engineering team applied the same method to understand and improve its own internal workflow.
We'll look at what each team mapped, what they learned, and what they did with those findings.
1. Reed College Library: finding a book in the stacks
In 2014, Reed College Library in Portland, Oregon, wanted to understand how students research a topic and find a book in the library.
They held four sessions with seven students from different years and majors, asking them to sketch their research processes and discuss how they found books in the library.
Throughout these sessions, the researchers found that students struggled with navigation. The signs weren't helping them reach their destinations, and the floor maps weren't oriented to where they were standing. Interestingly, only one student mentioned consulting a subject librarian during their research.
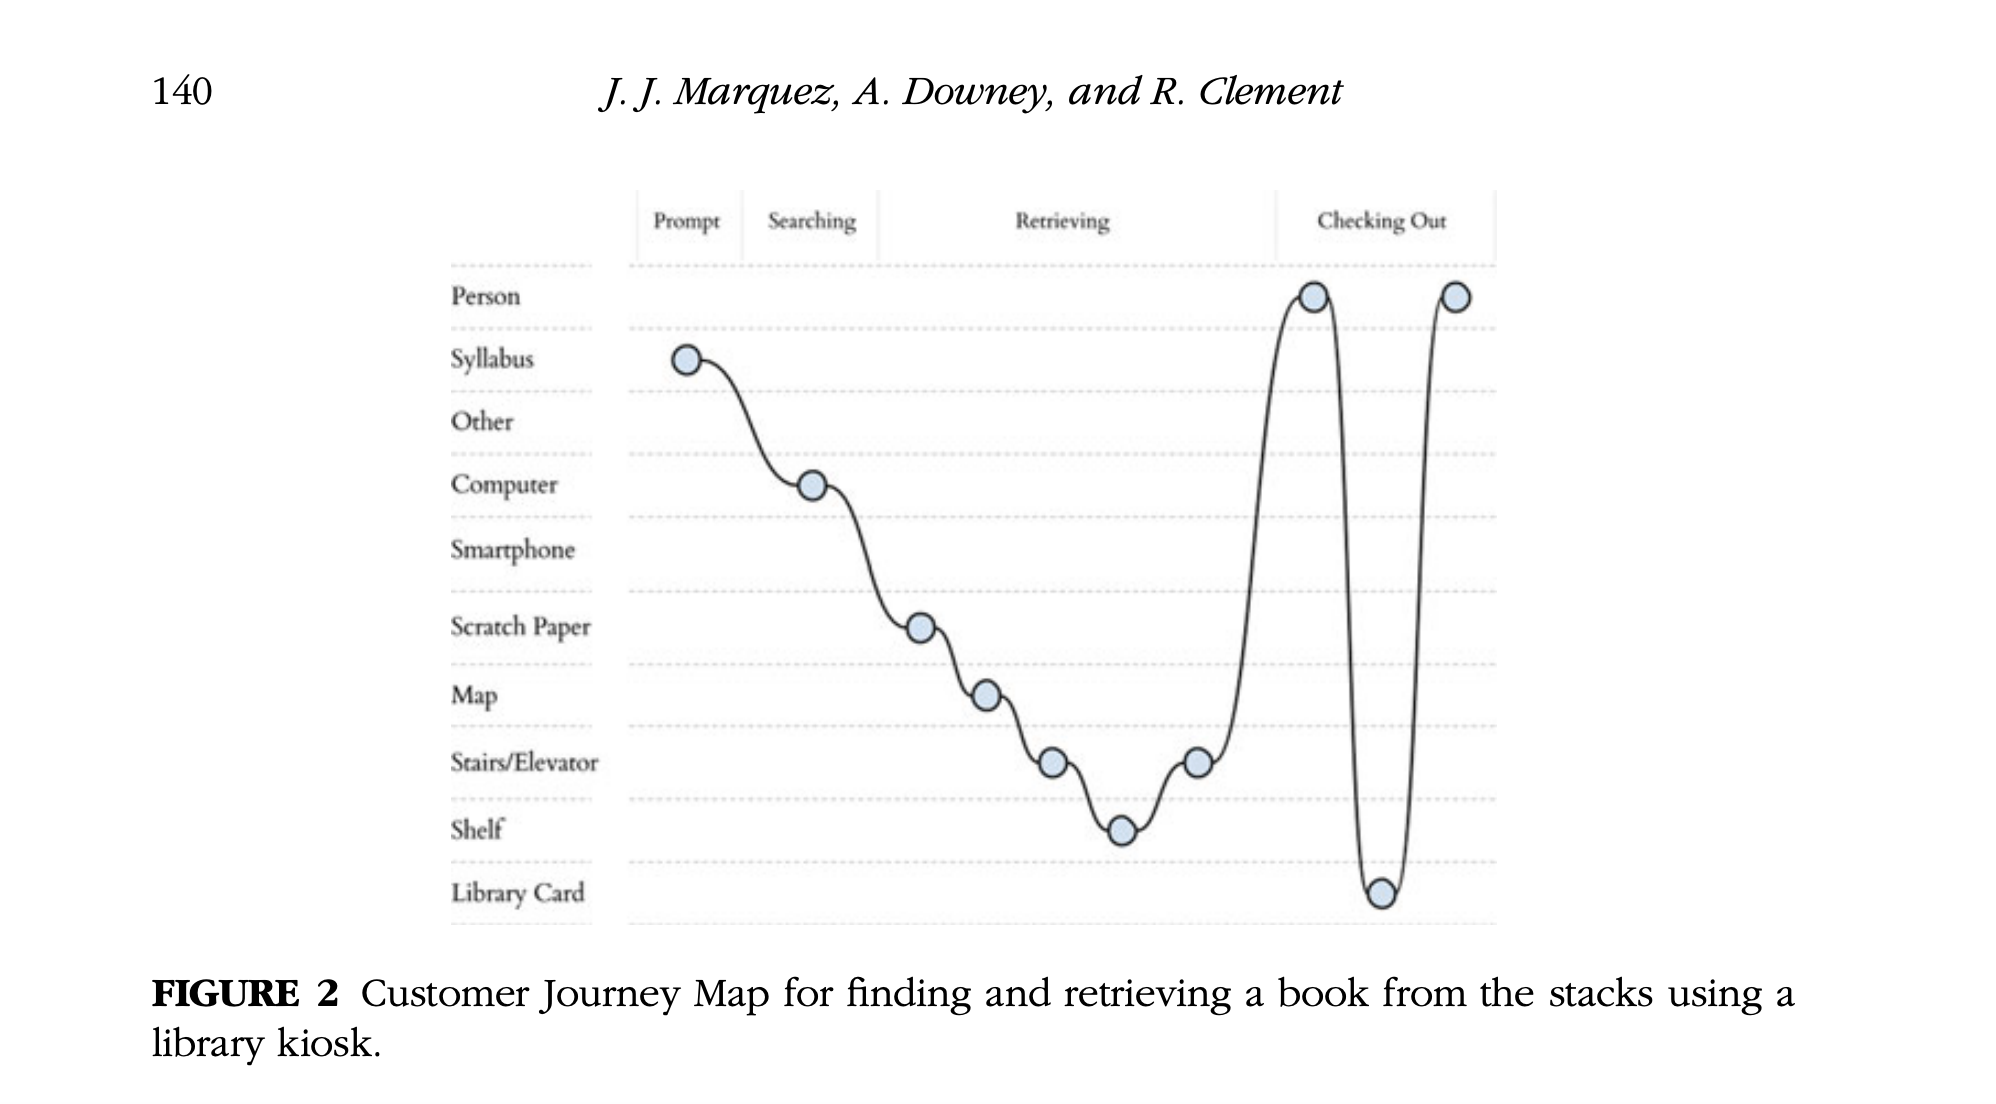
To make navigation easier, the researchers suggested highlighting the user's current floor in a colored box on the library maps. It's a small change, but one that directly addresses the confusion students experienced. The published study doesn't confirm whether the library went ahead with it.
For me, the takeaway is that we need to be careful about where we draw the boundaries of a user journey. Improving the online catalog wouldn't necessarily help students find their books any faster if they still got lost in the building. And that's something the team might have missed if they'd only looked at the digital experience.
2. GOV.UK One Login: creating an account at the start or midway
When users need to create an account to access a service, should we ask them to sign up right away or let them get started first?
I like how GOV.UK One Login approaches this. Instead of assuming there's one ideal journey, the team has published two different maps that government services can choose from.
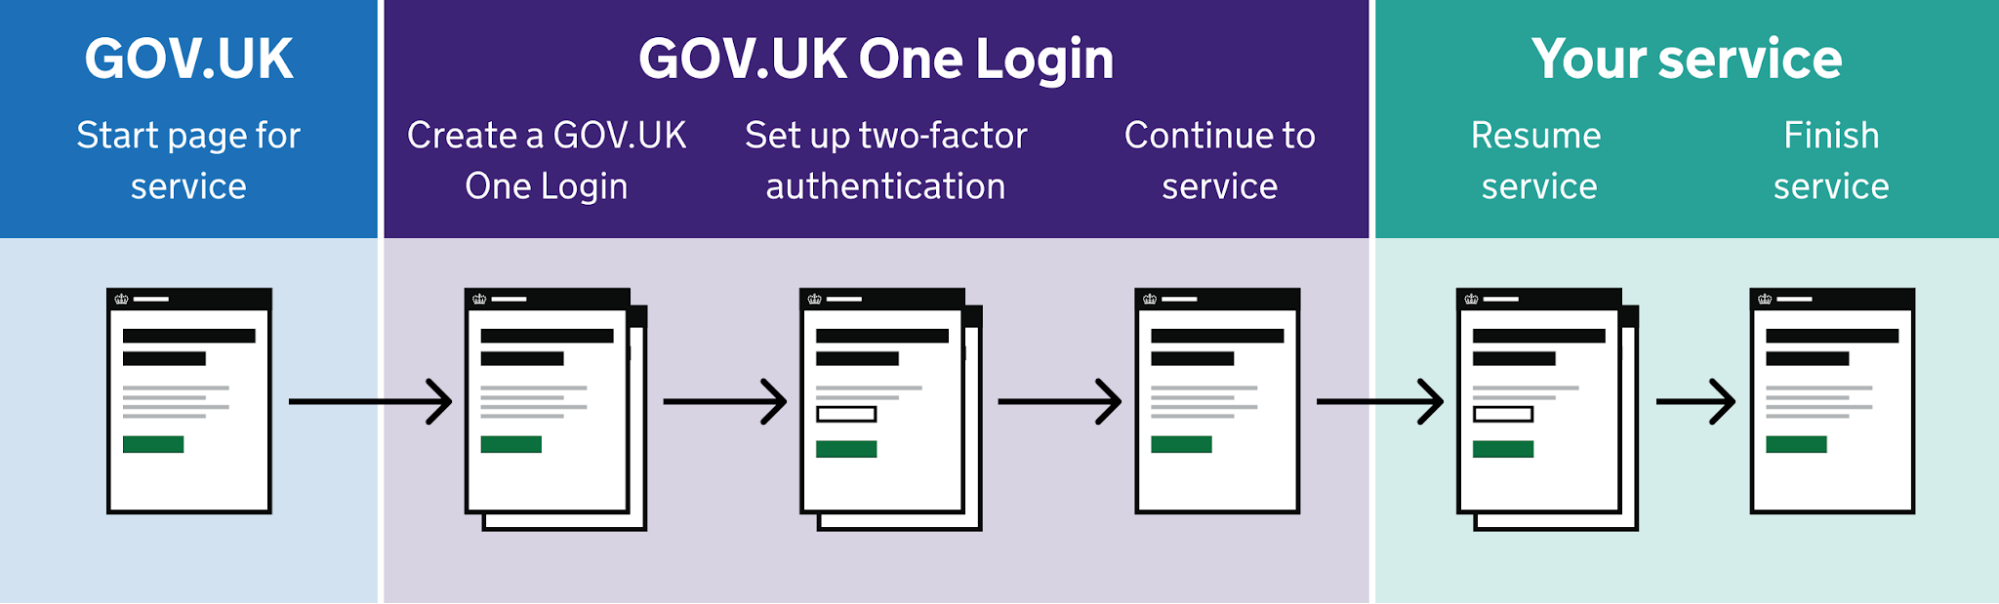
The first has users create an account upfront using their email, password, and two-factor authentication before continuing to the service.
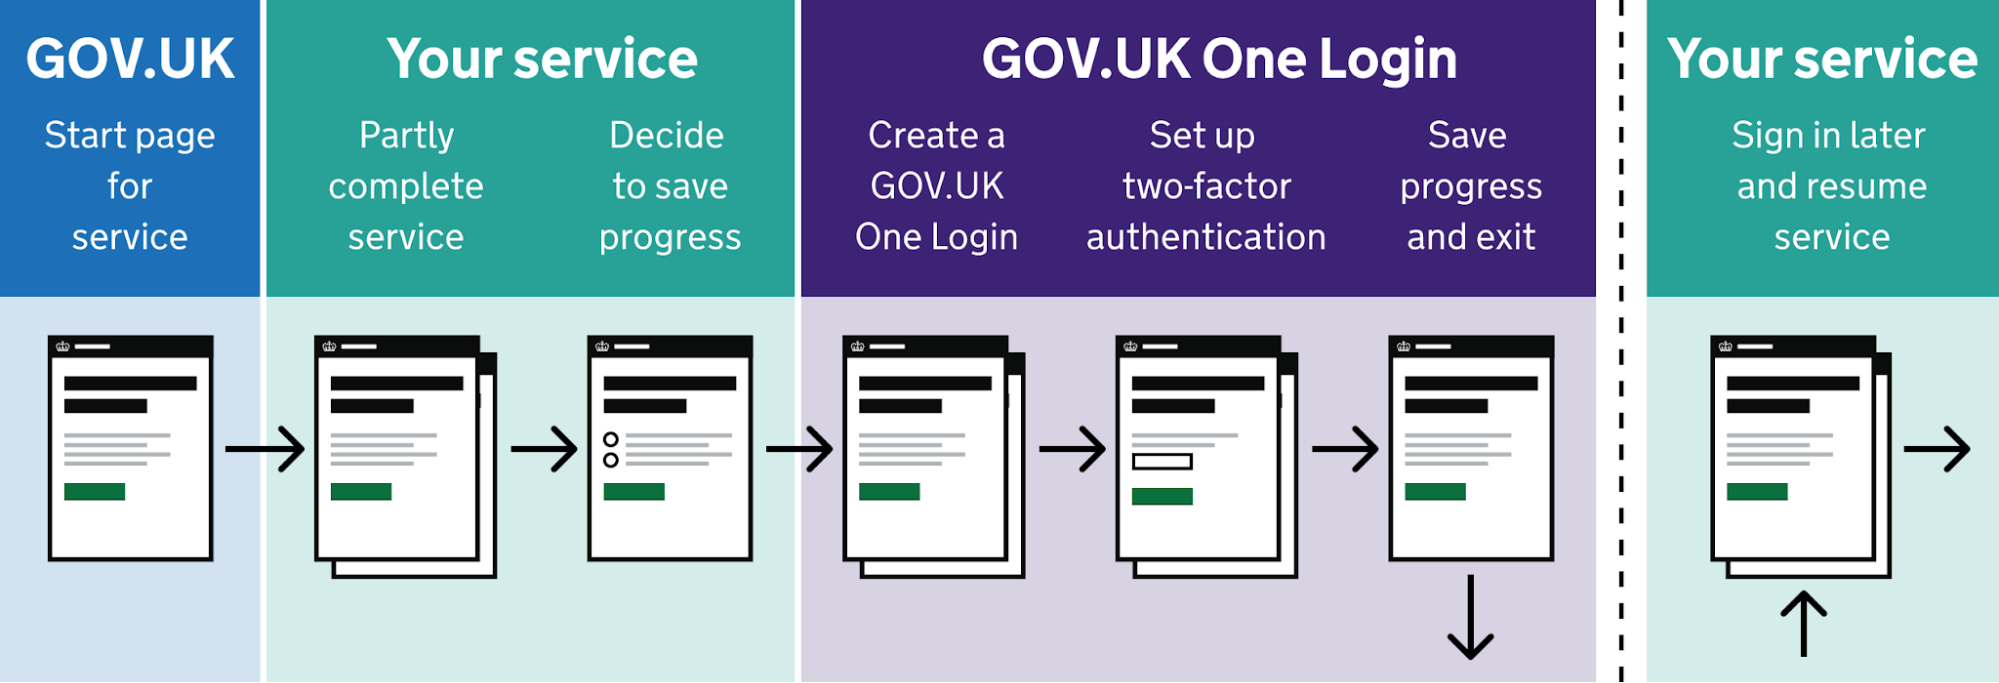
The second lets users complete part of the service first and only asks them to create an account when they want to save their progress and return later.
Both journeys have gone through multiple rounds of user testing. What's particularly useful is that GOV.UK publishes each journey map alongside a Figma prototype showing the screens users would encounter.
This is something I'd recommend doing with your own journey maps, too. Once you've mapped the experience you want to create, connect it to the screens that will deliver it. That way, your team can evaluate not only whether the journey makes sense, but also how it will work in practice.
3. Toptal: an engineering team's journey through product development
Sebastian Gherman, Toptal's Director of Product, wanted to understand where the team's development process was slowing people down. He organized two 90-minute workshops with an engineering manager, nine software engineers, and a QA engineer.
Together, they mapped the process from roadmap planning through implementation, testing, and release.
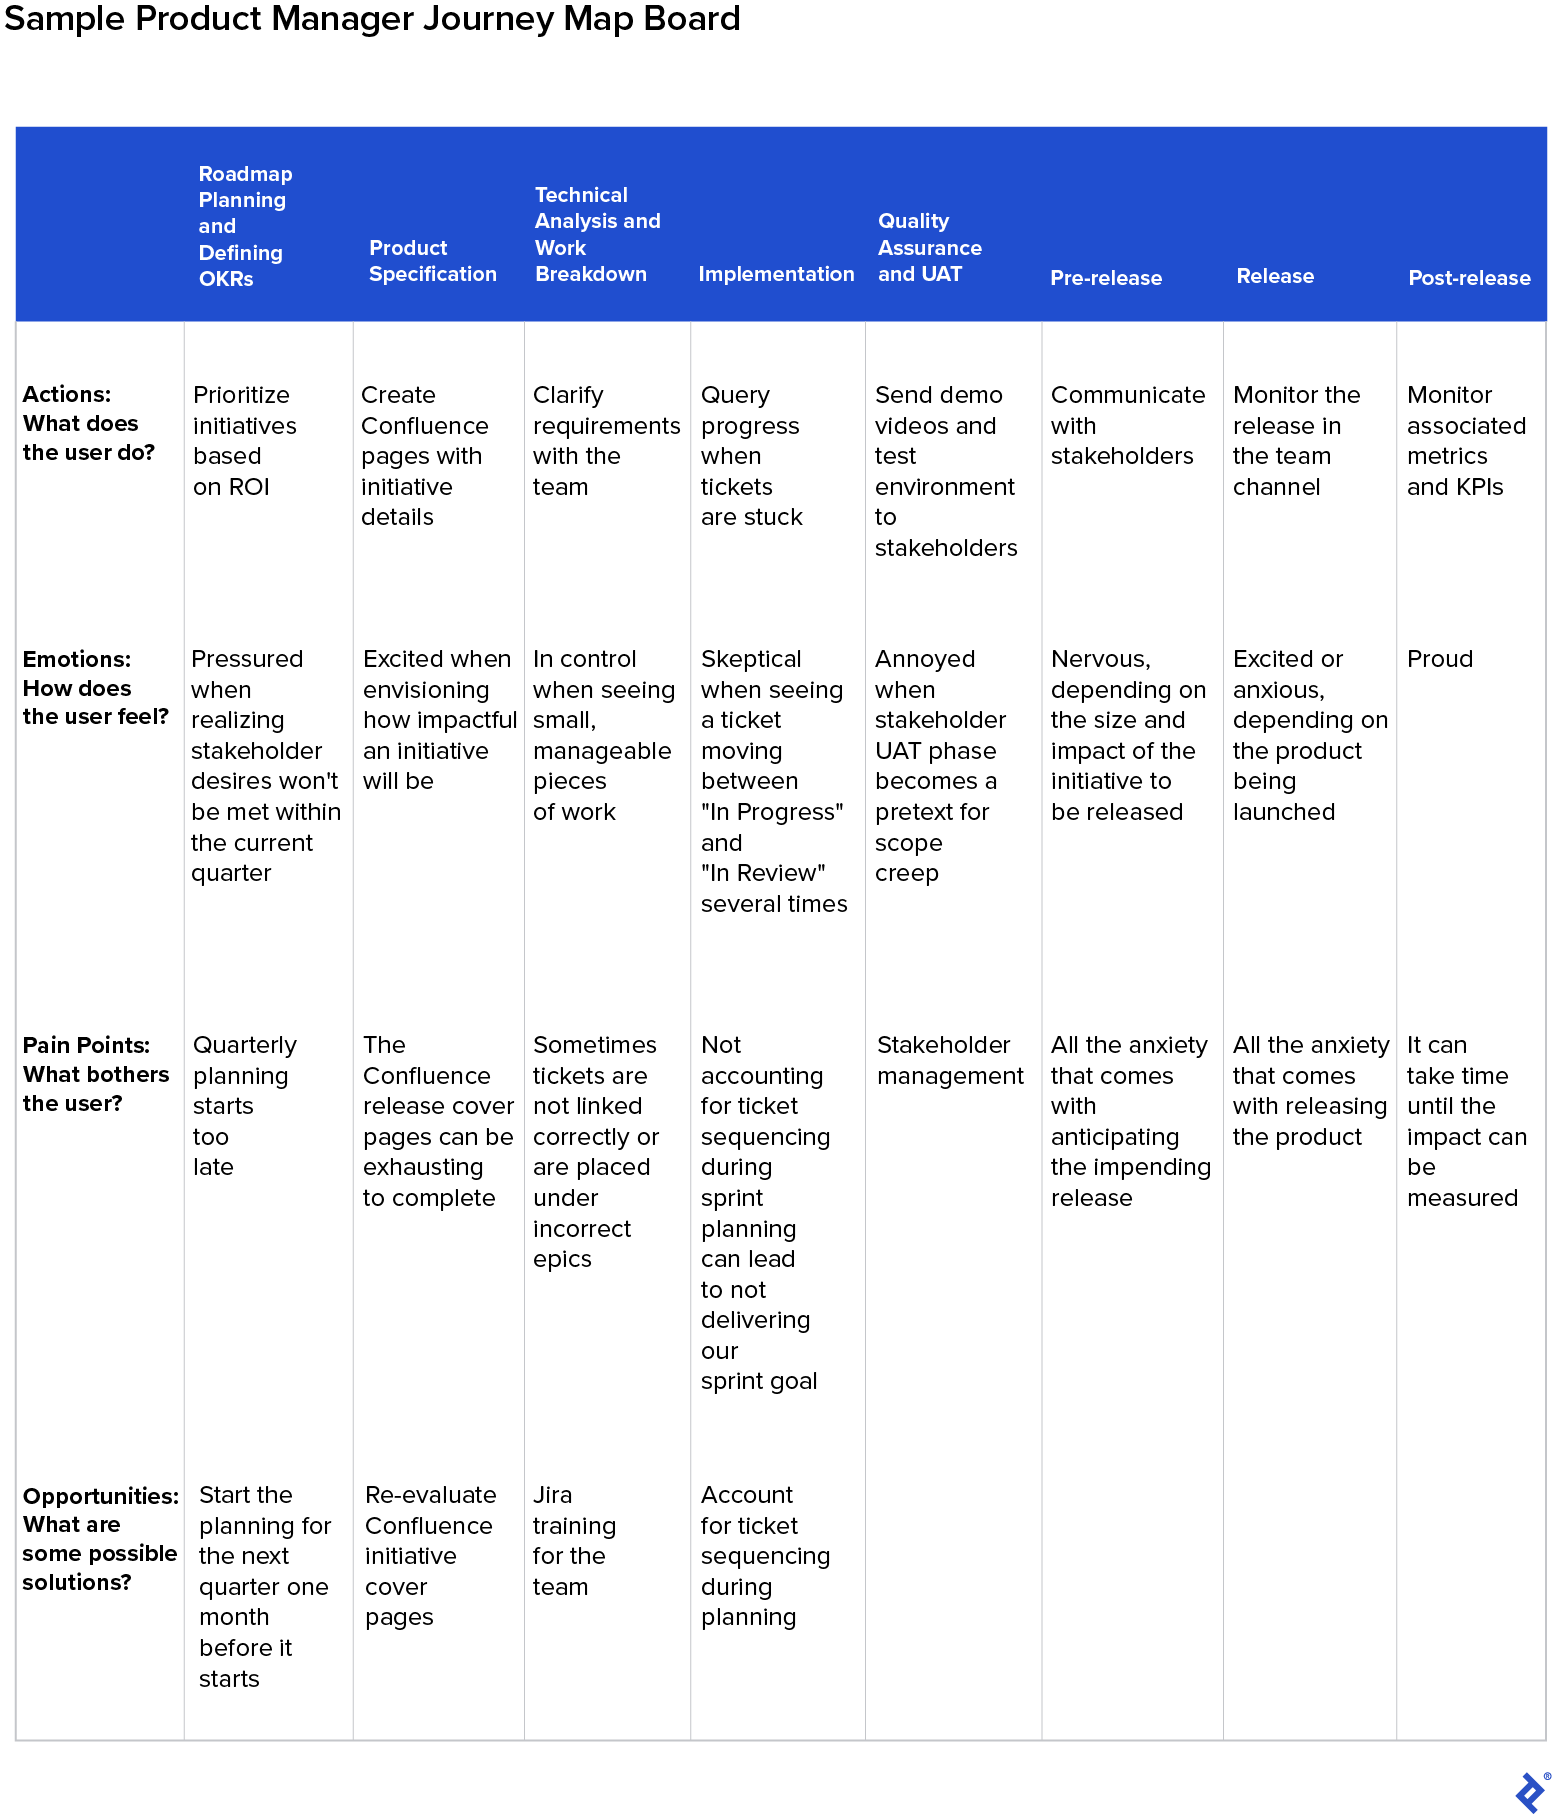
The exercise revealed a few things Gherman hadn't expected.
For example, several engineers thought they were the only ones struggling with the CI/CD pipeline, only to discover that others were having the same problems. Gherman also assumed recording demo videos was a burden for the team, but the engineers actually enjoyed doing it because it helped them practice their presentation skills.
Most of the pain points were concentrated around roadmap planning and implementation. The team followed up by reorganizing initiative documentation, addressing Jira training gaps, and improving the deployment workflow.
According to Toptal's case study, the updated process delivered measurable improvements. The average time tickets spent in review fell by 22%, while post-release bug reports decreased by 37%.
I think there's a useful lesson here for product managers. Your team members are also users of the processes and tools you've put in place. And just as you wouldn't want to redesign a product based entirely on assumptions, you shouldn't assume you know what's slowing your team down without asking them.
From a user journey map to screens users can test
A user journey map is only useful if it changes what you build next. Once you've mapped one persona's path to one goal, circled the lowest point and the end, and written the flow that fixes the worst moment, the next step is to put real screens in front of users.
In my Grammarly example, the map pointed to one moment: the jump from setup to a blank editor. The flow then gave me something specific to design and test. Without screens, that idea would have stayed a note on a map.
So turn your flow into screens, test them with a few users, and update the map with what you learn. Each round gives you a more accurate picture of the journey and a clearer next fix.
Key takeaways
- Map one persona and one goal, with a clear start and end point.
- Build the map from what users actually did, not from what the team assumes.
- Fix the lowest point and the final step first, following the peak-end rule.
- Turn the worst moment into a user flow, then into screens you can test.
- Update the map after every test so it stays a working tool.